## Abstract
Accurately predicting the next location of mobile phone users is essential for various applications such as personalized location-based services and mobile marketing. While previous models have relied primarily on spatiotemporal sequences (e.g., location and time information), recent research has begun to explore the integration of activity semantics, which provides contextual insights into the motivations behind mobility. However, the use of activity semantics remains underexplored in large-scale mobile phone data, where such semantics are not explicitly recorded. This study proposes a semantics-enhanced prediction framework that infers and integrates user activities into a long short-term memory (LSTM) architecture with attention mechanisms and multimodal embeddings. Specifically, we infer six types of activities: home and work using rule-based heuristics and four non-mandatory activities (shopping, leisure, eat out, and personal affairs) using a supervised machine learning approach. These inferred activities are encoded as embeddings and fused with spatiotemporal features within the model. The experimental results on mobile phone data from Guangzhou, China, demonstrate that the proposed model improves the prediction accuracy by 4.3–101% compared with baseline models that lack activity-level contextualization. Notably, users with more stable daily activity patterns benefit most significantly from the integration of activity semantics. This work highlights the potential of integrating inferred human activity types to enhance mobility prediction in data-rich but semantically sparse environments.
**Keywords:** Human mobility prediction; activity semantic inference; LSTM; mobile phone data; multimodal embeddings
## 1. Introduction
With the growing ubiquity of smartphones and location-based services, massive amounts of mobile phone
data are generated daily, which offers valuable insights into human mobility patterns (Shaw and Sui 2018;
Yuan 2018). Accurate next location prediction can enable businesses and service providers to deliver
personalized experiences (Hawalah and Fasli 2014) and optimize marketing strategies (Mahdizadeh and
Bahrak 2020). In addition to location-based services, accurate location prediction can also benefit many
other areas, such as epidemic prevention (Liu et al. 2023; Yabe et al. 2022), urban planning (Huang et al.
2015; Luca et al. 2023), and travel demand forecasting (Huang et al. 2018).
Traditionally, most location prediction models rely on spatial and temporal information in historical trajectory data. These models assume that individuals’ movement patterns are predominantly shaped by their past
locations and time-based routines, such as daily schedules. Among these models, Markov models are the most
influential because of their simplicity and effectiveness (Yu et al. 2017; Huang 2017; Li, Zou, and Xu 2022). With
the Markov model, the historical trajectory of each user is modeled as a 1-order or n-order Markov chain, and a
user’s next location is predicted using the transition probabilities between different visited locations that have
appeared in their historical trajectories (Huang 2017; Qiao et al. 2018). In recent years, deep learning models
have become increasingly popular for next location prediction. Recurrent neural networks (RNNs), especially
long short-term memory (LSTM) models, can effectively capture long-range dependencies in sequential data
and often outperform Markov models in terms of prediction accuracy (Choi, Yeo, and Kim 2018; Li et al. 2020;
Long et al. 2022; Solomon et al. 2021; Wang et al. 2024). In addition to RNNs, transformer-based approaches
have been proposed to address the limitations of sequential models by using self-attention mechanisms to
model spatiotemporal dependencies more flexibly (Hong, Martin, and Raubal 2022; Yang, Liu, and Zhao
2022). For instance, Hong, Martin, and Raubal (2022) proposed a transformer-based model that utilized historical travel behavior to predict individuals’ next location and achieved state-of-the-art prediction results on
two real-world GPS tracking datasets. Compared with sequential models, graph neural networks (GNNs) can
capture the spatiotemporal information and multidimensional interaction patterns embedded in mobility trajectories (Defferrard, Bresson, and Vandergheynst 2016; He et al. 2024; Hu et al. 2025). He et al. (2024) developed a heterogeneous graph-based model that integrates both physical and social influences on user mobility
and outperforms several baselines on social media datasets. However, the effectiveness of such models depends
heavily on graph construction strategies, and without explicit temporal modeling, they may fail to capture
dynamic movement patterns, particularly for users with irregular trajectories.
In parallel, recent studies have emphasized the role of underlying human activities in shaping mobility
(Huang and Li 2019; Liu et al. 2024; Mo et al. 2022; Shi et al. 2022). Visits to places such as restaurants,
shopping malls, or recreational sites reflect not only spatial transitions but also the behavioral intentions
behind them. Integrating activity semantics into location prediction models has the potential to improve
their accuracy by providing context that explains why users move between locations. The integration of
activity semantics into mobility prediction models has attracted increasing attention (Feng et al. 2022; Karatzoglou, Jablonski, and Beigl 2018; Li et al. 2015; Li, Zou, and Xu 2022; Toch et al. 2019). Many of these
studies rely on location data enriched with explicit user-generated activity labels, such as geotagged social
media data (Huang et al. 2021; Xu et al. 2020). To leverage activity semantics effectively, two main
approaches have been developed for integrating them into mobility prediction models. The first approach
explicitly uses activity semantics to narrow the search space of historical location sequences, thereby focusing predictions on locations that are possibly more associated with the user’s next activity. In this approach,
researchers typically construct sequences of users’ activities and then employ a Markov model to capture the
probabilistic transitions between activities and predict subsequent activities. Building on this, historical
location and time information are integrated with activity semantics to construct a probability model for
predicting the user’s next location. For example, Liao, Zhong, and Li (2017) combined the Markov
model with tensor decomposition to predict the probability of the next activity with public check-in datasets. They then applied kernel density estimation to model visit time distributions across locations, thereby
deriving posterior probability distributions for the next location. Similarly, Yu et al. (2017) constructed a
Markov model using activity sequences, considering activity transition probabilities and locations as
prior probabilities. Then, they applied Bayes’ theorem to refine predictions of the next location.
The second approach combines activity semantics with location and time information using embedding
methods and employs RNN-based models for next location prediction. For example, Yao et al. (2017) introduced a semantics-enhanced recurrent model that captures the spatiotemporal regularities enriched with
activity semantics underlying human movements through word vector embeddings. Feng et al. (2022)
used POI types and texts from geotagged social media data as activity semantics and employed embedding
representations to integrate them into attentional recurrent networks. Liu et al. (2024) embedded individual, location, activity, and time features into dense vectors and introduced an activity–location association
pruning approach to increase location prediction accuracy by leveraging semantic correlations. Compared
with the first approach, embedding-based methods are better suited for handling high-dimensional data and
capturing complex, nonlinear relationships among individuals’ locations, activity semantics, spatial patterns, and temporal dynamics.
While these approaches demonstrate the potential of activity semantics in enhancing prediction accuracy,
they are predominantly applied to datasets with explicit activity labels, such as geotagged social media data.
However, most passively collected trajectory data (e.g. GPS tracking data and mobile phone data) lack such
explicit activity labels. To address this gap, some researchers have attempted to infer user activities by associating GPS trajectories with nearby points of interest (POIs). Yet, accurately identifying user activities remains
challenging due to the high density and diversity of POIs in urban environments (Gong et al. 2016; Shen et al.
2022). This difficulty is further compounded when mobile phone data, which typically have much lower
temporal and spatial resolutions, are used (Ermagun et al. 2017; Liao 2023; Luo et al. 2024; Yin, Lin, and Zhao
2021). Despite these limitations, integrating inferred activity semantics into location prediction models using
mobile phone data holds considerable promise (Toch et al. 2019). Given its extensive population coverage
(Okmi et al. 2023; Tu et al. 2017), improving next location prediction for such data can enable a wide
range of reliable and personalized location-based services.
This paper aims to address this challenge by proposing a semantics-enhanced prediction framework that
enriches spatiotemporal trajectories with inferred user activities to provide behavioral context for mobility modeling. Specifically, we infer six types of activities: home and work using rule-based heuristics and four non-mandatory activities (shopping, leisure, eat out, and personal affairs) using a supervised machine learning approach.
These inferred activities are encoded as embeddings and fused with spatiotemporal features within an LSTM architecture equipped with attention mechanisms and multimodal embeddings. To evaluate the effectiveness of the
proposed approach, we conduct experiments using a large-scale mobile phone dataset from Guangzhou, China.
While more advanced model architectures, such as those based on transformers and GNNs, have been
proposed in recent years, we adopt the LSTM-based architecture with attention mechanisms in this study
for three main reasons. First, LSTM networks remain a strong and widely accepted model architecture for
sequential trajectory modeling because of their effectiveness in capturing temporal dependencies in sparse
mobile phone trajectory data (Wang et al. 2024). Second, this architecture provides better interpretability in
our context than alternatives such as GCNs and transformers do. The temporal attention mechanism in the
proposed LSTM-based architecture directly highlights influential time steps in the user’s trajectory, providing intuitive insights into the mobility decision process at the individual level. Third, the primary contribution of this work lies in the integration of inferred activity semantics into the location prediction task.
By grounding our method in a well-established and robust LSTM-based model, we are better able to isolate
and evaluate the specific contribution of semantic enrichment to prediction performance. This study contributes to the mobility prediction literature by (1) demonstrating the potential of integrated inferred
activity semantics in improving prediction accuracy for mobile phone data, and (2) revealing how these
improvements vary among users with different mobility patterns.
The rest of this paper is organized as follows. Section 2 introduces the problem and basic definitions.
Section 3 describes the methodology, including inferring activity semantics from mobile phone data and
predicting users’ next location using the activity semantics-enhanced approach. Section 4 introduces the
study area and data used. The experimental results and analysis are presented in Section 5. The final section
provides concluding remarks and future research directions.
## 2. Problem statement
In this study, we aim to predict the next locations of mobile phone users given their historical trajectories.
For simplicity, the urban space is divided into N grids, each representing a location. Before establishing the
mathematical model, we first introduce the definitions in this study.
**Definition 2.1 (Location Sequence):** A location sequence Su is the set of historical locations of user u. It is
defined as follows:
Su = {q1, q2, …, qN} (1)
where qn is a triple set (u, ln, tn) that consists of the location ln visited by user u at time tn. The transition from ln
to ln+1 represents movement between locations from tn to tn+1. However, ln and ln+1 must not be the same
location, as self-transitions are excluded.
**Definition 2.2 (Activity Sequence):** An activity sequence Pu is the set of activities of user u. It is defined as
follows:
Pu = {p1, p2, …, pN} (2)
where pn is a triple set (u, an, tn) representing the activity type an in which user u is engaged at time tn. In this
study, the activity types include two primary activities (i.e. home and work) and four non-mandatory activities
(i.e. eat out, shopping, leisure, and personal affairs).
This study aims to predict the next location, ln+1, that a given user u will visit by learning the mobility
patterns from their historical location sequence Su and activity sequence Pu. The prediction task is formulated as a multiclass classification problem, outputting a probability ranking of candidate locations. The
location with the highest probability is subsequently selected as the predicted next location for user u.
## 3. Methodology
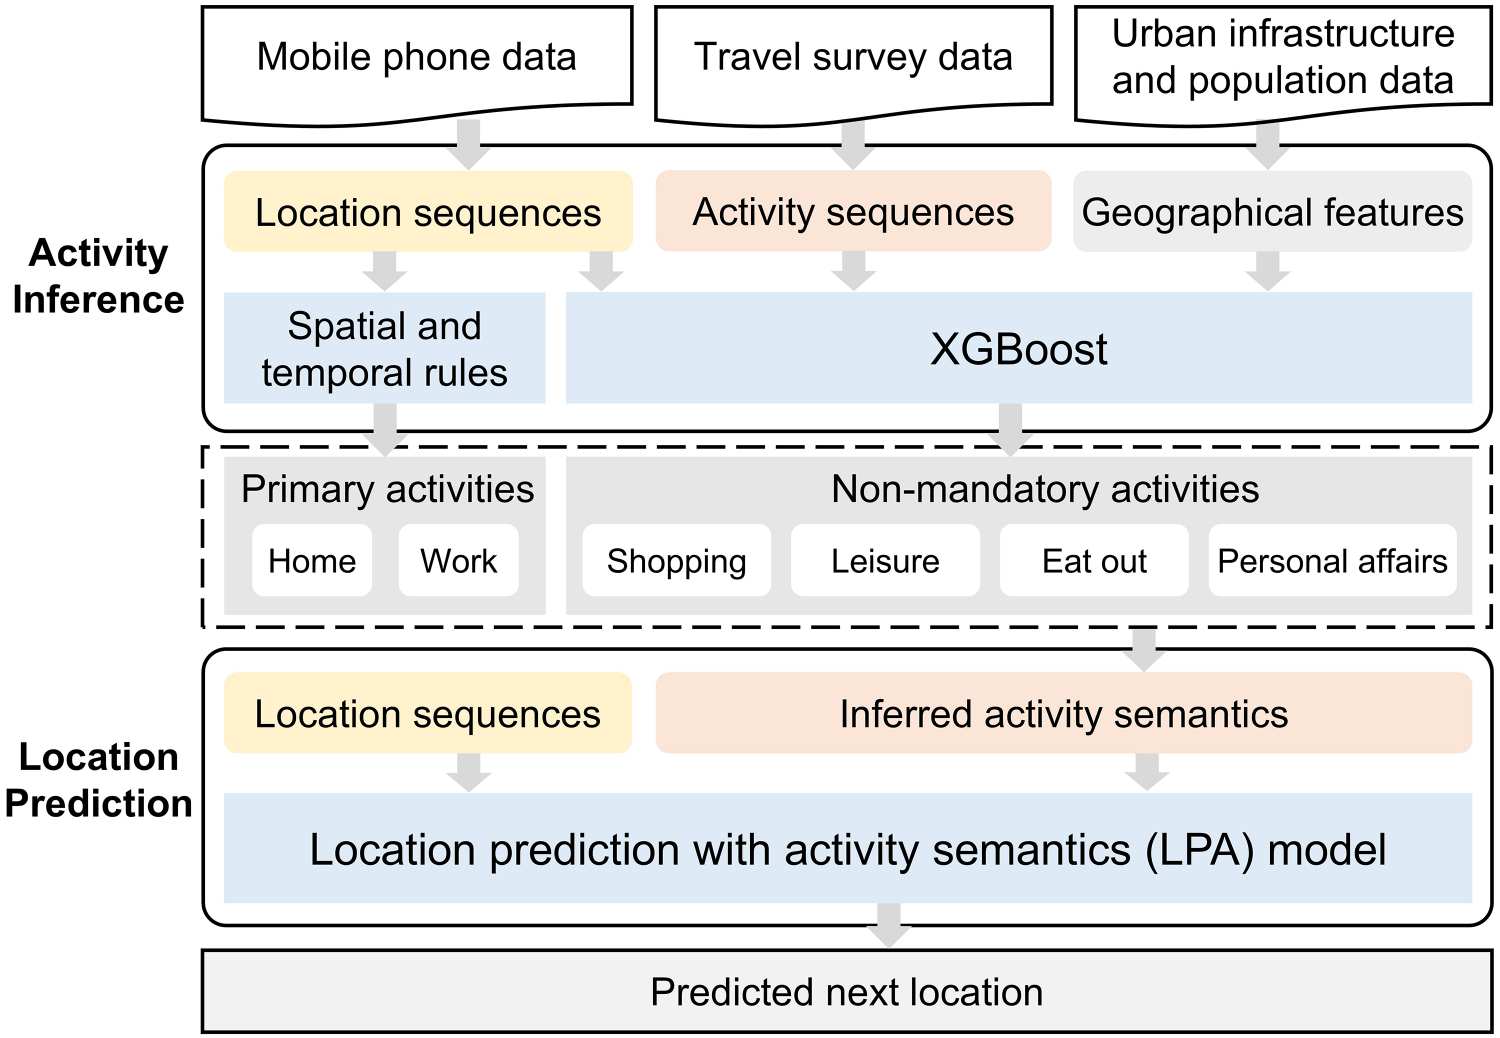
The methodology framework used in this study is presented in Figure 1. First, we infer activity semantics
from mobile phone data using spatiotemporal rules and an XGBoost model learned from travel survey data.
Then, the inferred activity semantics and corresponding location sequences are utilized to train the location
prediction with activity semantics (LPA) model. Finally, the trained LPA model is employed to predict
users’ next locations by integrating the activity context.
### 3.1. Inferring activity semantics from mobile phone data
#### 3.1.1. Inferring home and work activities using spatial and temporal rules
Home and work activities constitute the majority of urban residents’ daily routines and exhibit regular patterns. Previous studies (Tu et al. 2017; Xu et al. 2015) infer these activities using specific spatial and temporal
rules. Home activities are inferred when an individual stays at a single location for at least half of the time
between 00:00 and 6:00, designating this location as their home. Similarly, work activities are inferred when
an individual stays at a location for at least half of the time during working hours (09:00–12:00, 14:00–
17:00), provided that this location differs from their identified home.
#### 3.1.2. Inferring non-mandatory activities using the XGBoost model
Since travel survey data provide detailed activity information, many studies have used supervised machine
learning models to learn the relationships between spatiotemporal factors and activity types from travel survey data (Diao et al. 2016; Zhu 2022). These models are then applied to infer activities from large-scale
location data, such as mobile phone trajectories.
Figure 1. Research framework.
This study employs the XGBoost model, a widely used machine learning approach, to infer non-mandatory activities. XGBoost is an ensemble learning algorithm based on decision trees (Chen and Guestrin
2016). XGBoost has been extensively adopted for its strong learning capability and generalizability (Ji
et al. 2022; Parsa et al. 2020). Following the methodology of Zou et al. (2025), we extract 23 factors related
to time, location, activity dependency, and the built environment.
The time attributes include the activity start time and duration, both of which are derived from travel
survey data. For location attributes, three factors are considered: distance to home, distance to the nearest
bus stop, and distance to the nearest metro station. The built environment characteristics are captured using
12 factors derived from population and POI data. The built environment factors are aggregated at 250 m ×
250 m grid cells to align with the activity locations in the travel survey data. This grid scale is supported by
previous research (Chen et al. 2024b; Hu and Han 2019), which revealed that it is effective for capturing and
representing urban functional features. The built environment factors include population and the number
of 11 types of urban facilities with specific functions (i.e. restaurants, retail stores, life services, leisure, medical services, tourism, residential areas, government offices, educational institutions, financial institutions,
and companies) within each grid cell where activities occur. Additionally, six activity dependency factors
are defined to capture the sequential relationships between an activity and its preceding or subsequent
activities. For a detailed description of these factors, please refer to Zou et al. (2025).
The XGBoost model takes a 23-dimensional feature vector as input and outputs probabilities for classifying samples into one of the following categories: eat out, leisure, shopping, or personal affairs. For model
training, the samples are split into a training set (70% of the total samples) and a testing set (the remaining
30%). The trained XGBoost model is subsequently applied to mobile phone data to infer non-mandatory
activities. The performance of the XGBoost model is assessed in terms of accuracy and the kappa coefficient.
These two metrics together provide a comprehensive assessment of classification reliability and agreement.
### 3.2. Predicting the next location of individuals by integrating activity semantics
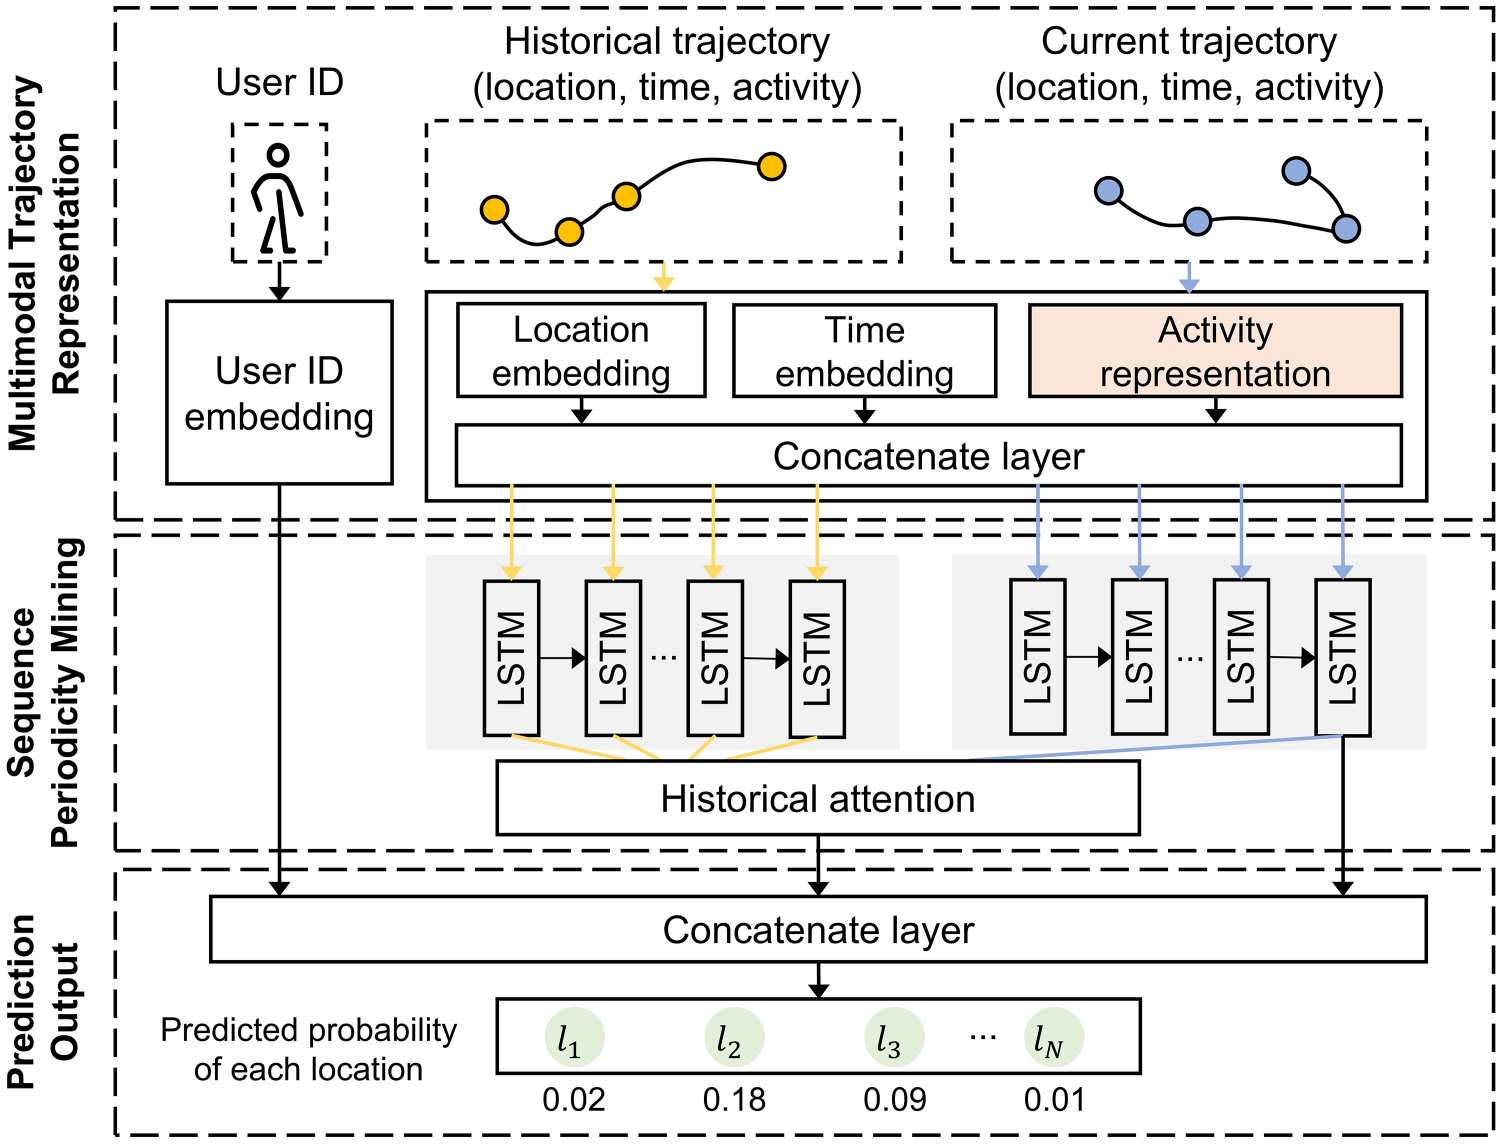
The proposed model, named the location prediction with activity semantics (LPA) model (Figure 2), comprises three main components: (1) multimodal trajectory representation, which fuses spatial, temporal, and activity semantic information to create a comprehensive representation of user movements; (2) sequence periodicity mining, which captures recurring patterns in individual mobility; and (3) prediction output, which generates the next location prediction on the basis of the enriched trajectory features.
Figure 2. Overall structure of the Location Prediction with Activity semantics (LPA) model.
#### 3.2.1. Multimodal trajectory representation
The inputs of our proposed model are user trajectories, which encompass individual identity, spatial,
and temporal dimensions. Specifically, we integrate activity sequence Pu with location sequence Su to
form activity semantics-augmented trajectories. These records, represented as (u, l, t, a), include
user IDs, locations, timestamps, and activity details. To represent these diverse data types, we employ
embedding techniques to generate feature vectors for user IDs, locations, timestamps, and activity
details. A multimodal embedding module is used to concatenate the resulting embeddings for information
fusion.
_**Activity semantics representation**_ **:** Here, we exploit the type of activity inferred in Section 3.1 to represent the activity semantics of user’s stay. Since activity types are discrete variables, we represent them
using one-hot vectors. After one-hot encoding, a trainable embedding matrix maps one-hot vectors to
efficient representations of activity semantics for the predictive model. The representation of activity
semantics e(a) is formulated as:
e(a) = WAxA(a) (3)
where xA(a) represents the one-hot coding for activity type a. WA is a trainable weight matrix.
_**Location embedding**_ **:** For a location l in a trajectory, its embedding feature is represented as:
e(l) = WLxL(l) (4)
where e(l) ∈ ℝdL represents the embedding of location l, with dL denoting the dimensionality of the embedding feature. xL(l) is a one-hot vector representing the index of location l within the set of locations.
WL ∈ ℝdL×|L| is a weight matrix of size dL × |L|, and |L| represents the size of the location set. By mapping
each location to a vector in a dL-dimensional space, we can effectively handle massive locations in subsequent neural networks. User trajectories are divided into current and historical components. The current
trajectory captures the user’s recent visits, reflecting their immediate state, whereas the historical trajectory
provides long-term patterns and preferences, such as travel rhythms.
_**Time embedding and user ID embedding**_ **:** The time embedding feature e(t) and user ID embedding feature e(u) are formulated as follows:
e(t) = WTxT(t) (5)
e(u) = WUxU(u) (6)
where xT(t) represents the one-hot vector for time t. WT ∈ ℝdT×|T| is a trainable weight matrix. |T| denotes
the size of the time set, and dT represents the dimensionality of the time embedding. xU(u) is the one-hot
vector representing user u, and WU ∈ ℝdU×|U| is a trainable weight matrix. |U| denotes the size of the user
set, and dU represents the dimensionality of the user embedding.
_**Multimodal trajectory representation**_ **:** Multimodal trajectory embedding combines individual features,
spatial features, temporal features, and activity type features into a dense representation. This allows the
model to capture complex associations across these dimensions. The multimodal representation for the
n-th record in user a’s sequence is given by:
xn = [e(ln); e(tn); e(an)] (7)
where [; ; ] denotes the matrix concatenation operation. Notably, user ID embedding is integrated in the
later prediction stage.
#### 3.2.2. Capturing periodicity via LSTM and attention mechanisms
Human mobility patterns exhibit periodicity, which can be extracted from historical trajectories and utilized
for predicting individuals’ locations. To capture the temporal dependencies in these trajectories, this study
employs LSTM networks, which can mitigate the vanishing gradient problem through gating mechanisms
that enable controlled information flow and facilitate effective gradient propagation. To enhance prediction
performance, we integrate an attention mechanism to weight and combine temporal features from historical
trajectories, ensuring that the model focuses on the historical information most relevant to the current
context.
LSTM is used to extract complex sequential information and dependencies between sequences from
both the current and historical trajectories. Further details of the LSTM structure are provided in Appendix
A. The temporal dependence between the visited records in the trajectory is captured and incorporated
into the output hidden state when the multimodal embeddings of the trajectory are fed into the LSTM
layer. Therefore, the temporal correlation features of the historical and current trajectories are represented
as follows:
where Hhis and Hcur are the temporal features of the historical trajectory and current trajectory, respectively.
hms and hn denote the corresponding output hidden states of the historical and current trajectory, respectively. xms and xn refer to the representations of the multimodal embedding of the historical and current trajectories, respectively.
Individual historical trajectories can reveal stable travel preferences over extended periods. Integrating long-term preferences with recent mobility states would benefit the forecast of future steps. To
achieve this, an attention mechanism is utilized to depict the most relevant temporal features from
the historical trajectory. This mechanism directs the model’s focus towards historical segments
strongly correlated with the current trajectory’s temporal context. This process is mathematically
expressed as:
where cn represents the contextual information from the historical trajectory that is most relevant to
the temporal feature of the current trajectory at timestamp tn. The function HisAttn refers to the
historical attention operation.
#### 3.2.3. Predicting the next location of individuals using feature fusion
The prediction outcome is generated on the basis of the fused features, which include the temporal dependence states of the current semantic trajectory, the corresponding contextual information from the historical semantic trajectory, and the user identity. Leveraging these integrated features, the proposed model
calculates the probability of the next locations being visited as follows:
h′n = [hn; cn; e(u)] (11)
l̂n+1 = FCLayerLP(h′n) = Softmax(Wph′n + bp) (12)
where l̂n+1 represents the predicted probability distribution over possible locations that u might visit at time
tn+1. FCLayerLP represents the fully connected layer. Wp and bp are the trainable weight and bias in the fully
connected layer, respectively. Therefore, the goal of the training process is to maximize the probability of the
true location ln+1 within the predicted probability distribution, given the current and historical semantic
trajectories. This objective can be represented as:
where ln+1 denotes the true location visited by user u at time tn+1. Ψ is the set of location candidates in the
training set. ϑ refers to the set of trainable parameters of the model.
## 4. Data description and experimental setup
### 4.1. Data description
In this study, we use mobile phone data from Guangzhou, China, provided by a major cellular operator to
verify the effectiveness of our proposed approach. The dataset comprises 22.8 million records from 1.6
million users, covering five consecutive working days from October 12 to October 16, 2020. To protect
user privacy, all personal information is excluded, and each phone user in the dataset is anonymized
with a unique user ID. The dataset documents the user ID, date, time, longitude, and latitude. Stay locations
are detected using the clustering-based method proposed by Xu et al. (2021). After detecting stay locations,
we include only users with at least two such locations per day across all five working days to ensure data
quality. Additionally, we utilize data from a 2017 travel survey conducted among urban residents in
Guangzhou and POI data obtained from the Gaode API ([https://www.amap.com/](https://www.amap.com/)) to assist in inferring
the activities corresponding to the detected stay locations.
The travel survey data involve 1,050 households selected from 12 typical residential communities representing all community types in Guangzhou, with 1,003 valid questionnaires collected. Participants are
required to report their activity diaries within a recent weekday, detailing all home and work activities lasting more than 30 min and other activities (e.g. eat out, shopping, leisure activities) lasting more than
10 min. Further details on the travel survey data can be found in Zou et al. (2025).
_**Ethical approval:**_ This study does not involve medical experiments. All participants in our travel survey
provided written informed consent authorizing the use of their data for research purposes. The travel survey
data are anonymized to ensure participant privacy and confidentiality. The mobile phone data used in this
study are fully anonymized and provided by a licenced telecommunications provider under strict data protection protocols. All the user identifiers are irreversibly hashed, and no personally identifiable information
is accessible at any stage. Only aggregate temporal patterns (e.g. nighttime or daytime visit regularity) are
used to in infer home and work activities, without any attempt to reidentify users or link the results to
specific individuals.
### 4.2. Experimental setup
We use two popular metrics to evaluate the performance of different prediction models: prediction accuracy
at K (ACC@K) (Jin et al. 2022) and normalized discounted cumulative gain at K (NDCG@K) (Chen et al.
2024a). ACC@K measures how often the model’s top K predictions match the actual next location.
NDCG@K assesses whether the top K predicted locations are ranked correctly according to the user’s actual
likelihood of visiting them. Higher values of ACC@K and NDCG@K indicate better prediction performance. The formulas for these metrics are as follows:
where |U| is the number of users in the test data, SuK is the set of the top K predicted locations for
user u, and Suvisited represents the locations actually visited by user u. I(·) is used to index the correct
results in the first K predictions, and Suj denotes the result of the j-th predicted location for user u. zu
is the normalization constant representing the maximum value of DCG@K to normalize the index. In
this study, K = {1, 3} is selected. Note that NDCG@1 is equivalent to ACC@1 and is therefore not
reported.
To evaluate the efficiency of our model, we compare it with the following baseline models:
(a) Factorizing personalized Markov chains (FPMC): FPMC is a combination of matrix decomposition
and the Markov chain method, and it can not only model user preferences but also consider sequence
features (Rendle, Freudenthaler, and Schmidt-Thieme 2010).
(b) LSTM: This model is an RNN architecture used in the field of deep learning (Sutskever, Martens, and
Hinton 2011). In this model, the trajectory of each user is modeled as a time sequence, and the long-range dependencies are considered.
(c) DeepMove: This model is also an RNN architecture for mobility prediction but has attentional mechanisms for capturing multilevel periodicity (Feng et al. 2018).
(d) GCN-based model: Different from the RNN architecture, this model considers trajectories as graphs
and uses graph convolutional operators to capture temporal dependencies of the trajectories (Defferrard, Bresson, and Vandergheynst 2016).
(e) Transformer-based model: This model adopts a Transformer decoder architecture to predict the next
location by capturing complex temporal dependencies through self-attention mechanisms (Hong, Martin, and Raubal 2022).
We use 80% of each user’s historical trajectories for training and reserve 20% for testing. The Adam
algorithm is employed to control the overall training process, with the cross-entropy loss function selected
for optimization. The batch size is set to 20 for all the deep learning models. To prevent model overfitting,
L2 regularization is applied to network parameters with weights of 1 × 10⁻⁵. We use an adaptive strategy for
learning rate adjustment, initializing it at 0.001. If learning stagnates for more than three training epochs,
the learning rate is reduced by a factor of 0.1. The maximum number of training epochs is set at 30, and the
training process is complete if the learning rate drops below 9 × 10⁻⁶ or upon reaching the maximum epoch.
The experiment is conducted in Python. The prediction model algorithms are implemented using the
PyTorch deep learning framework, with computational acceleration provided by the CUDA and cuDNN
graphical processing architectures.
## 5. Experimental results
### 5.1. Inferred activities in mobile phone data
We first infer home and work activities from individuals’ trajectories using spatial and temporal rules,
with home activities for 98.16% of mobile phone users and work activities for 89.47% of users successfully inferred. Next, an XGBoost model on travel survey data is trained to capture the relationships
between non-mandatory activities and their associated features. Applying this model to mobile
phone data yields an overall accuracy of 78.63% and a kappa coefficient of 0.66. The accuracy varies
by activity type: 82.34% for eat out, 79.05% for personal affairs, 73.53% for leisure, and 43.48% for
shopping. On the basis of the model’s predictions, we infer 455,943 non-mandatory activities for
nearly 188,000 users, distributed as follows: 41.65% personal affairs, 27.61% eat out, 25.19% leisure,
and 5.55% shopping.
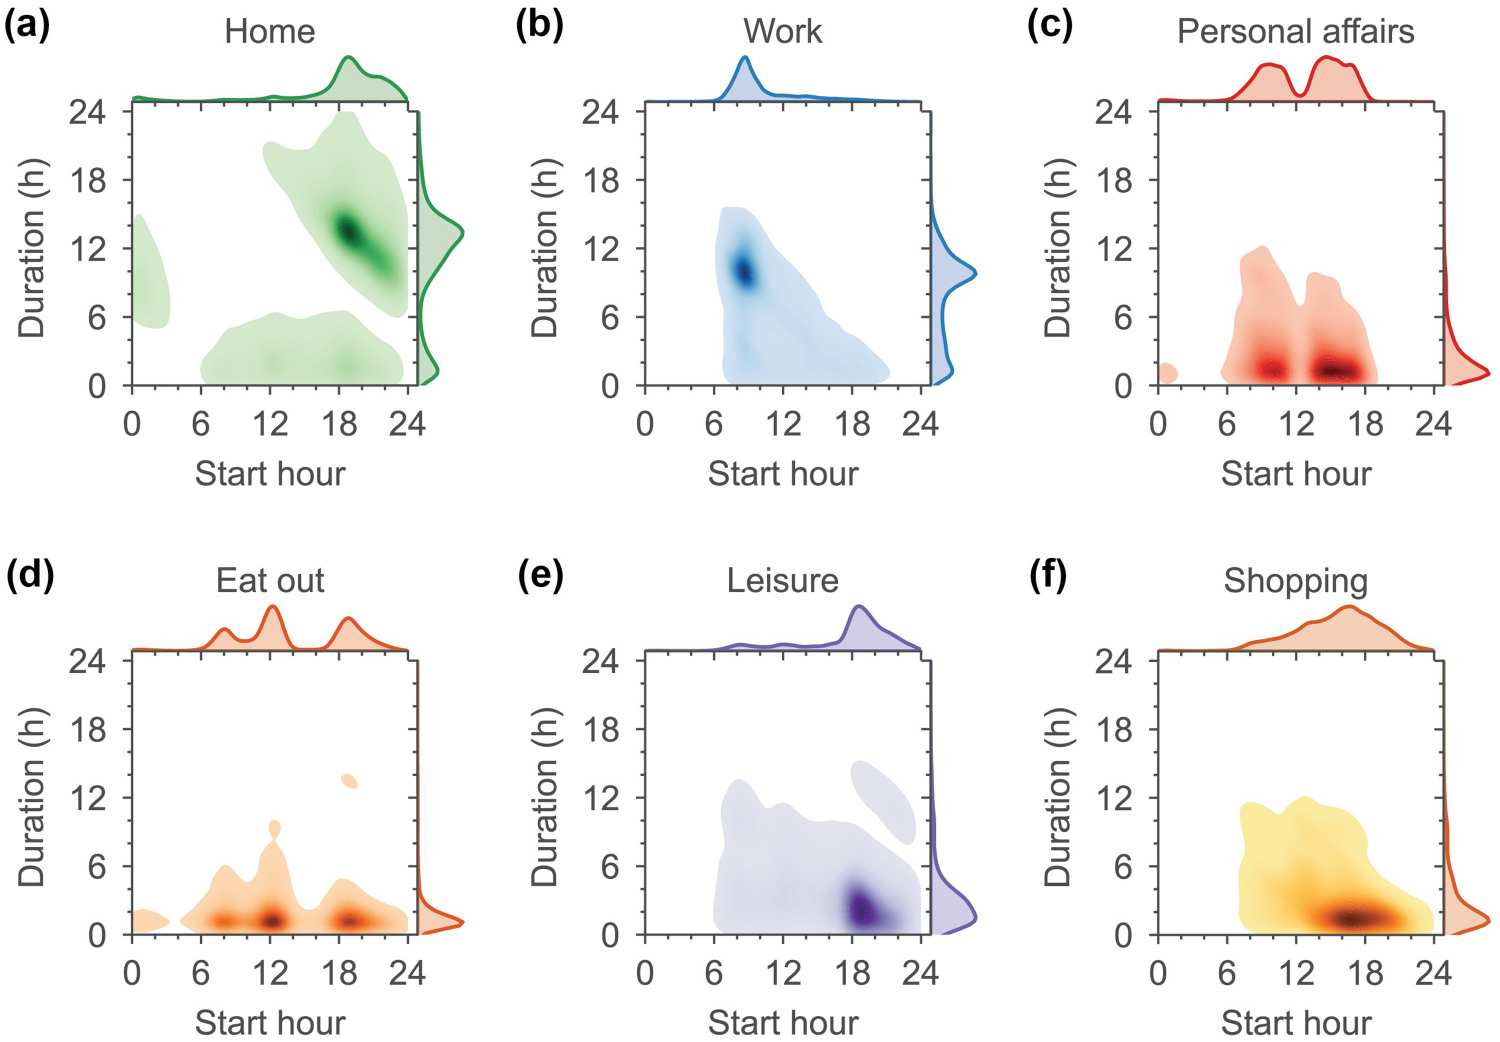
As illustrated in Figure 3, the time spent at home and at work constitutes the majority of daily time, averaging approximately 12 and 10 h, respectively. Personal affairs typically occur during office hours, averaging
approximately 2 h. Eat out tends to cluster at approximately 8:00, 12:00, and 19:00. Leisure and shopping
activities are mostly scheduled during off-work hours, such as in the evening. These patterns reveal the basic
rhythm of daily activities and support the validity of the inferred activity types.
Figure 3. Joint distribution of activity start time and duration for home, work, and non-mandatory activities.
### 5.2. Next location prediction results and analysis
#### 5.2.1. Model performance
#### (1) Overall performance
The LPA model, which integrates both primary and non-mandatory activities, is utilized for evaluation. As
shown in Table 1, while the GCN- and transformer-based models outperform the simpler baselines (FPMC
and LSTM), they do not match the performance of our proposed models. We observe that the transformer-based model (ACC@1: 0.4612) performs better than the GCN-based model (ACC@1: 0.4347), but both fall
short of the DeepMove and LPA models.
Table 1. Performance comparison of different prediction models.
Methods
ACC@1
ACC@3
NDCG@3
FPMC
0.3159 ± 0.0009
0.5069 ± 0.0027
0.4303 ± 0.0020
LSTM
0.3592 ± 0.0008
0.5114 ± 0.0010
0.4507 ± 0.0007
GCN-based
0.4347 ± 0.0350
0.6195 ± 0.0625
0.5462 ± 0.0522
Transformer-based
0.4612 ± 0.0050
0.6643 ± 0.0132
0.5841 ± 0.0100
DeepMove
0.6096 ± 0.0009
0.8486 ± 0.0013
0.7536 ± 0.0007
LPA
0.6356 ± 0.0013
0.8564 ± 0.0014
0.7690 ± 0.0012
The lower performance of the transformer-based model may be attributed to the nature of the mobile
phone dataset, which usually consists of sparse trajectories with irregular time intervals. While transformer-based architectures have demonstrated superior performance in various sequence modeling tasks,
they typically rely on dense and regularly sampled input data. In contrast, RNN-based models such as DeepMove and LPA are better suited to handle irregular and sparse temporal sequences, because of their use of
attention mechanisms and multimodal embeddings. Moreover, the proposed LPA model outperforms
DeepMove, indicating that the performance gains are not merely due to model architecture but are largely
driven by the integration of inferred activity semantics. Compared with all the baselines, LPA improves the
ACC@1 by 4.3% to as much as 101%. LPA also achieves the best performance in terms of both ACC@3 and
NDCG@3.
To validate that the improvements of the LPA model over the baselines are statistically meaningful,
paired t-tests are conducted between the proposed LPA model and the baseline models. The results indicate
that the performance improvements of the LPA model over all the baseline models are statistically significant (p < 0.001) across all the evaluation metrics.
#### (2) Performance comparison across users with different daily travel patterns
We further analyze the performance of the LPA model across different population groups. As shown in
Table 2, the mobile phone users whose home activities are successfully identified primarily fall into three
categories. Approximately 39.34% of users engage exclusively in home and work activities, categorized as
the standard commuting population. Additionally, 9.85% of the users who participate in home and non-mandatory activities are categorized as workplace-free population. The largest group comprises users
involved in home, work, and non-mandatory activities, categorized as the multi-activity population,
accounting for 50.81% of all mobile phone users.
Table 2. Categories and corresponding percentage of users with different activity patterns.
Mobile phone user categories
Activity patterns
Number of users
Percentage (%)
Standard commuting population
Home + Work
73,919
39.34
Workplace-free population
Home + Non-mandatory activities
18,513
9.85
Multi-activity population
Home + Work + Non-mandatory activities
95,464
50.81
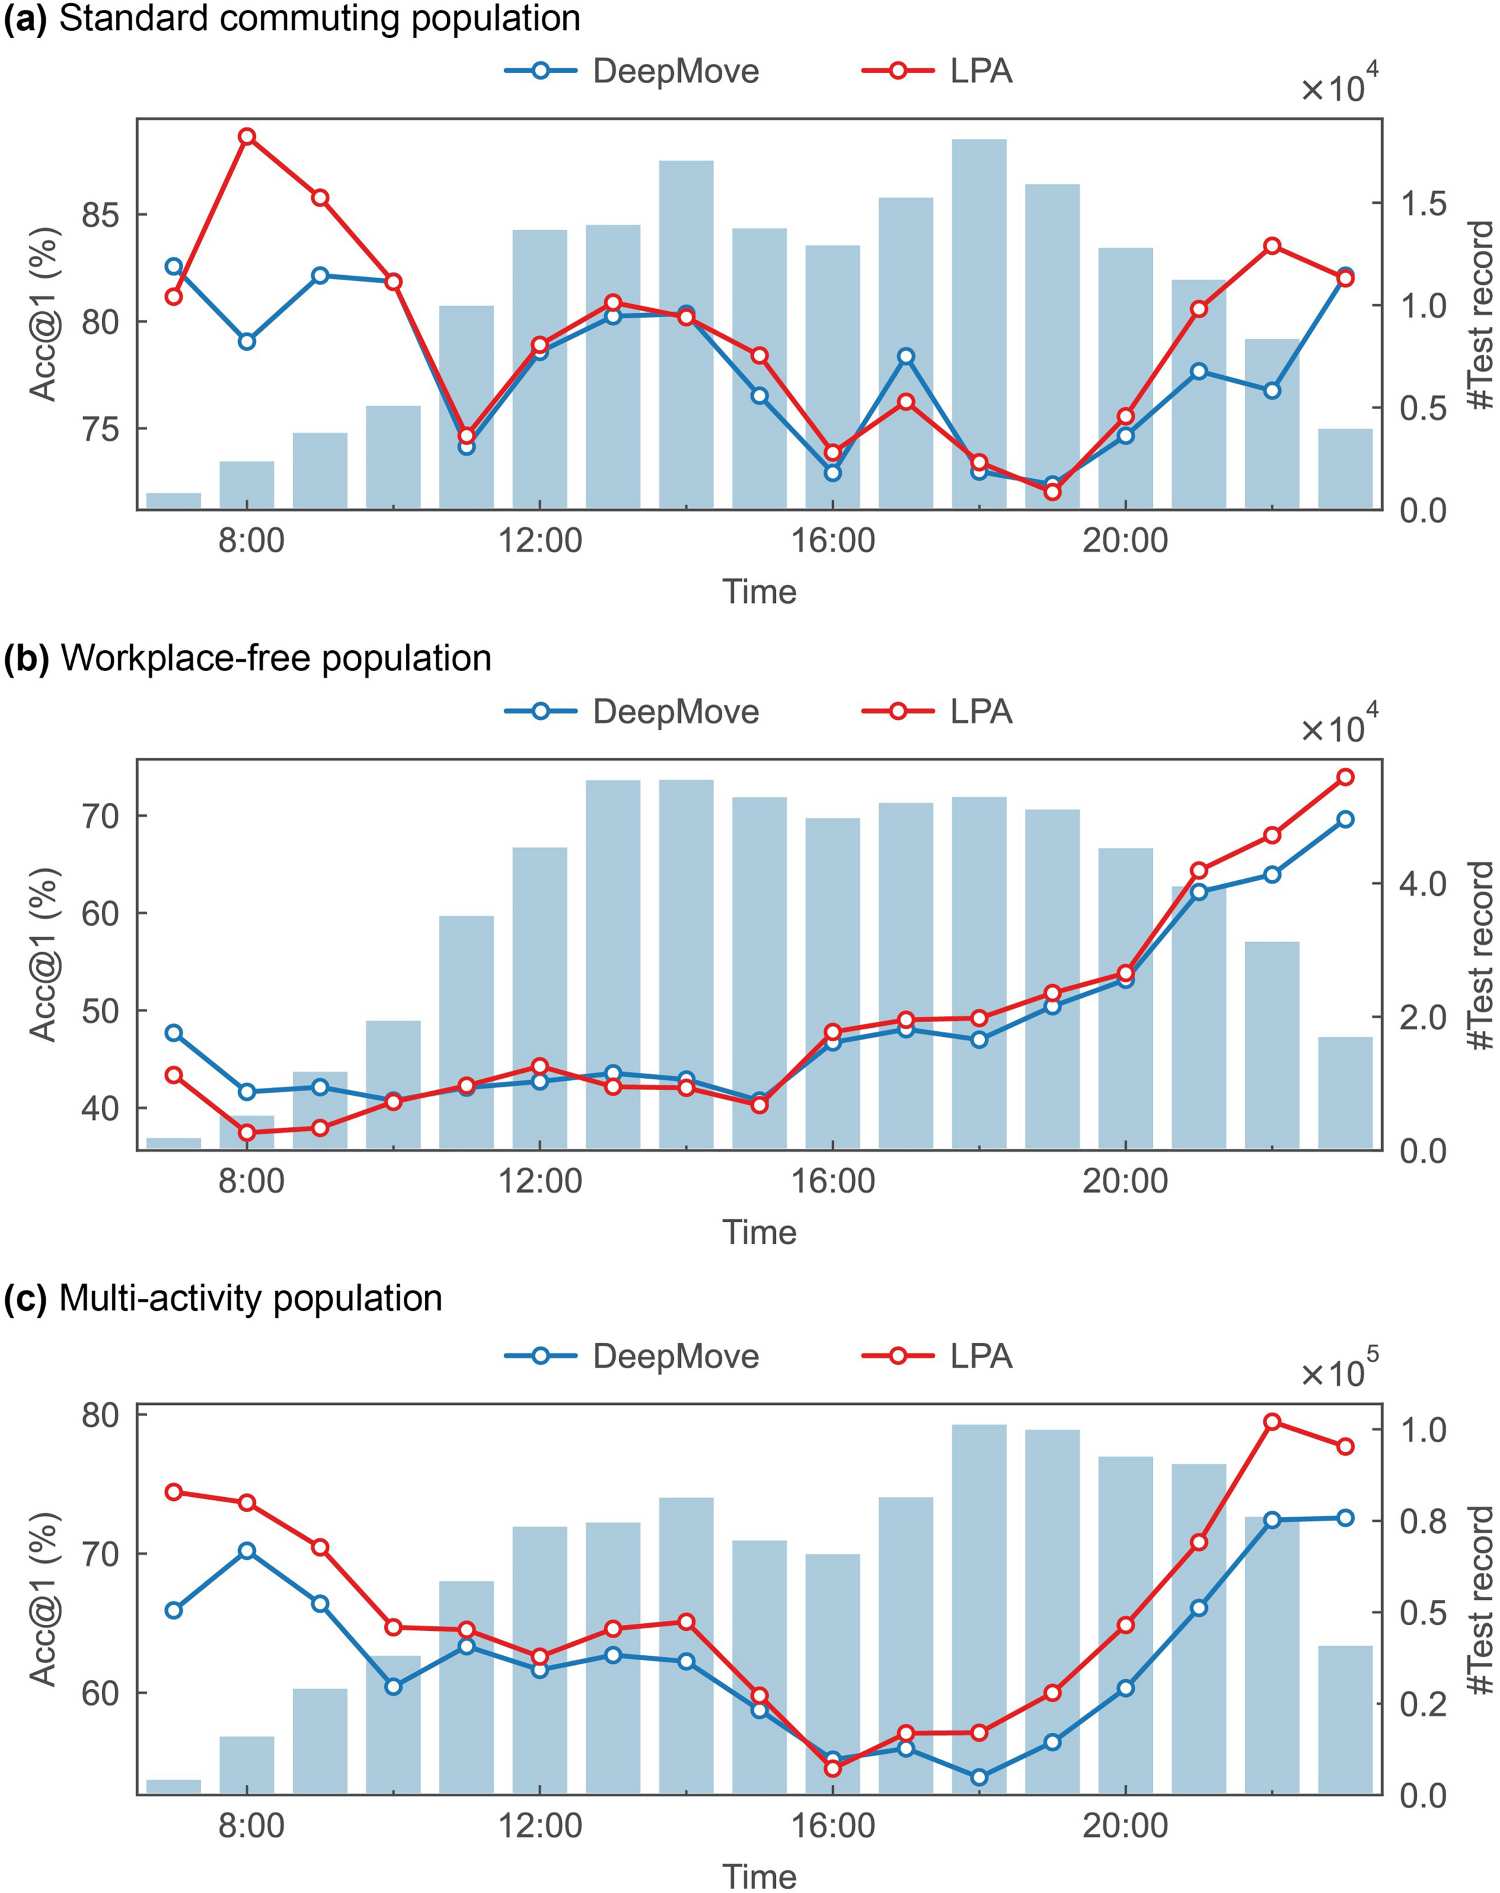
In Figure 4(a), the proposed model shows significant improvements in prediction accuracy during the
morning and evening for the standard commuting population, specifically at approximately 8:00 and
9:00, as well as after 20:00. It maintains an accuracy comparable to that of DeepMove between 10:00 and
19:00. This result suggests that explicitly tagging home and work activities in individual trajectories aids
in predicting commuting behaviors, such as traveling to work or returning home. The activity tags enable
the model to effectively leverage learned mobility patterns from other users.
Figure 4. Performance of the DeepMove and LPA models across users with different daily travel patterns.
Both the LPA and DeepMove models exhibit relatively lower accuracy for the workplace-free population
than for the standard commuting population (Figure 4(b)). However, LPA shows noticeable improvements
when predicting locations after 16:00, particularly after 20:00. This improvement is possibly due to the higher
frequency of recorded home-returning activities in the evening. Conversely, during the morning rush hour,
the LPA model slightly deviates. This may be attributed to the predominance of non-mandatory activities in
the morning, where integrating activity semantics could introduce additional uncertainty for this population.
Notably, the workplace-free population analyzed in our study may partially include users with irregular mobility patterns, such as tourists or gig workers, who do not follow fixed daily routines. The relatively low prediction accuracy observed for this group underscores the challenge of capturing unpredictable behaviors.
However, the improved performance of the LPA model during evening hours suggests that certain consistent
patterns, such as returning to accommodations, can still be effectively learned.
For the multi-activity population (Figure 4(c)), the largest group, the LPA model demonstrates promising
performance, outperforming DeepMove by a margin of over 10%. This significant improvement may be
attributed to the regular activity patterns observed in this population, which engage in more non-mandatory
activities during the afternoon and evening than other groups do. By explicitly integrating non-mandatory
activities, the LPA model effectively captures the interplay between primary and non-mandatory activity patterns. However, limited improvement is observed at 16:00 because of the diverse travel patterns during this
time. As inferred in Section 5.1, personal affairs are frequently conducted at approximately 16:00, resulting
in substantial variation in travel destinations. Overall, the performance of the proposed LPA model varies
across different populations. Integrating activity semantics significantly enhances the prediction accuracy
for users with more stable travel patterns, although handling diverse patterns remains a challenge.
#### 5.2.2. Effects of activity semantics on next location prediction
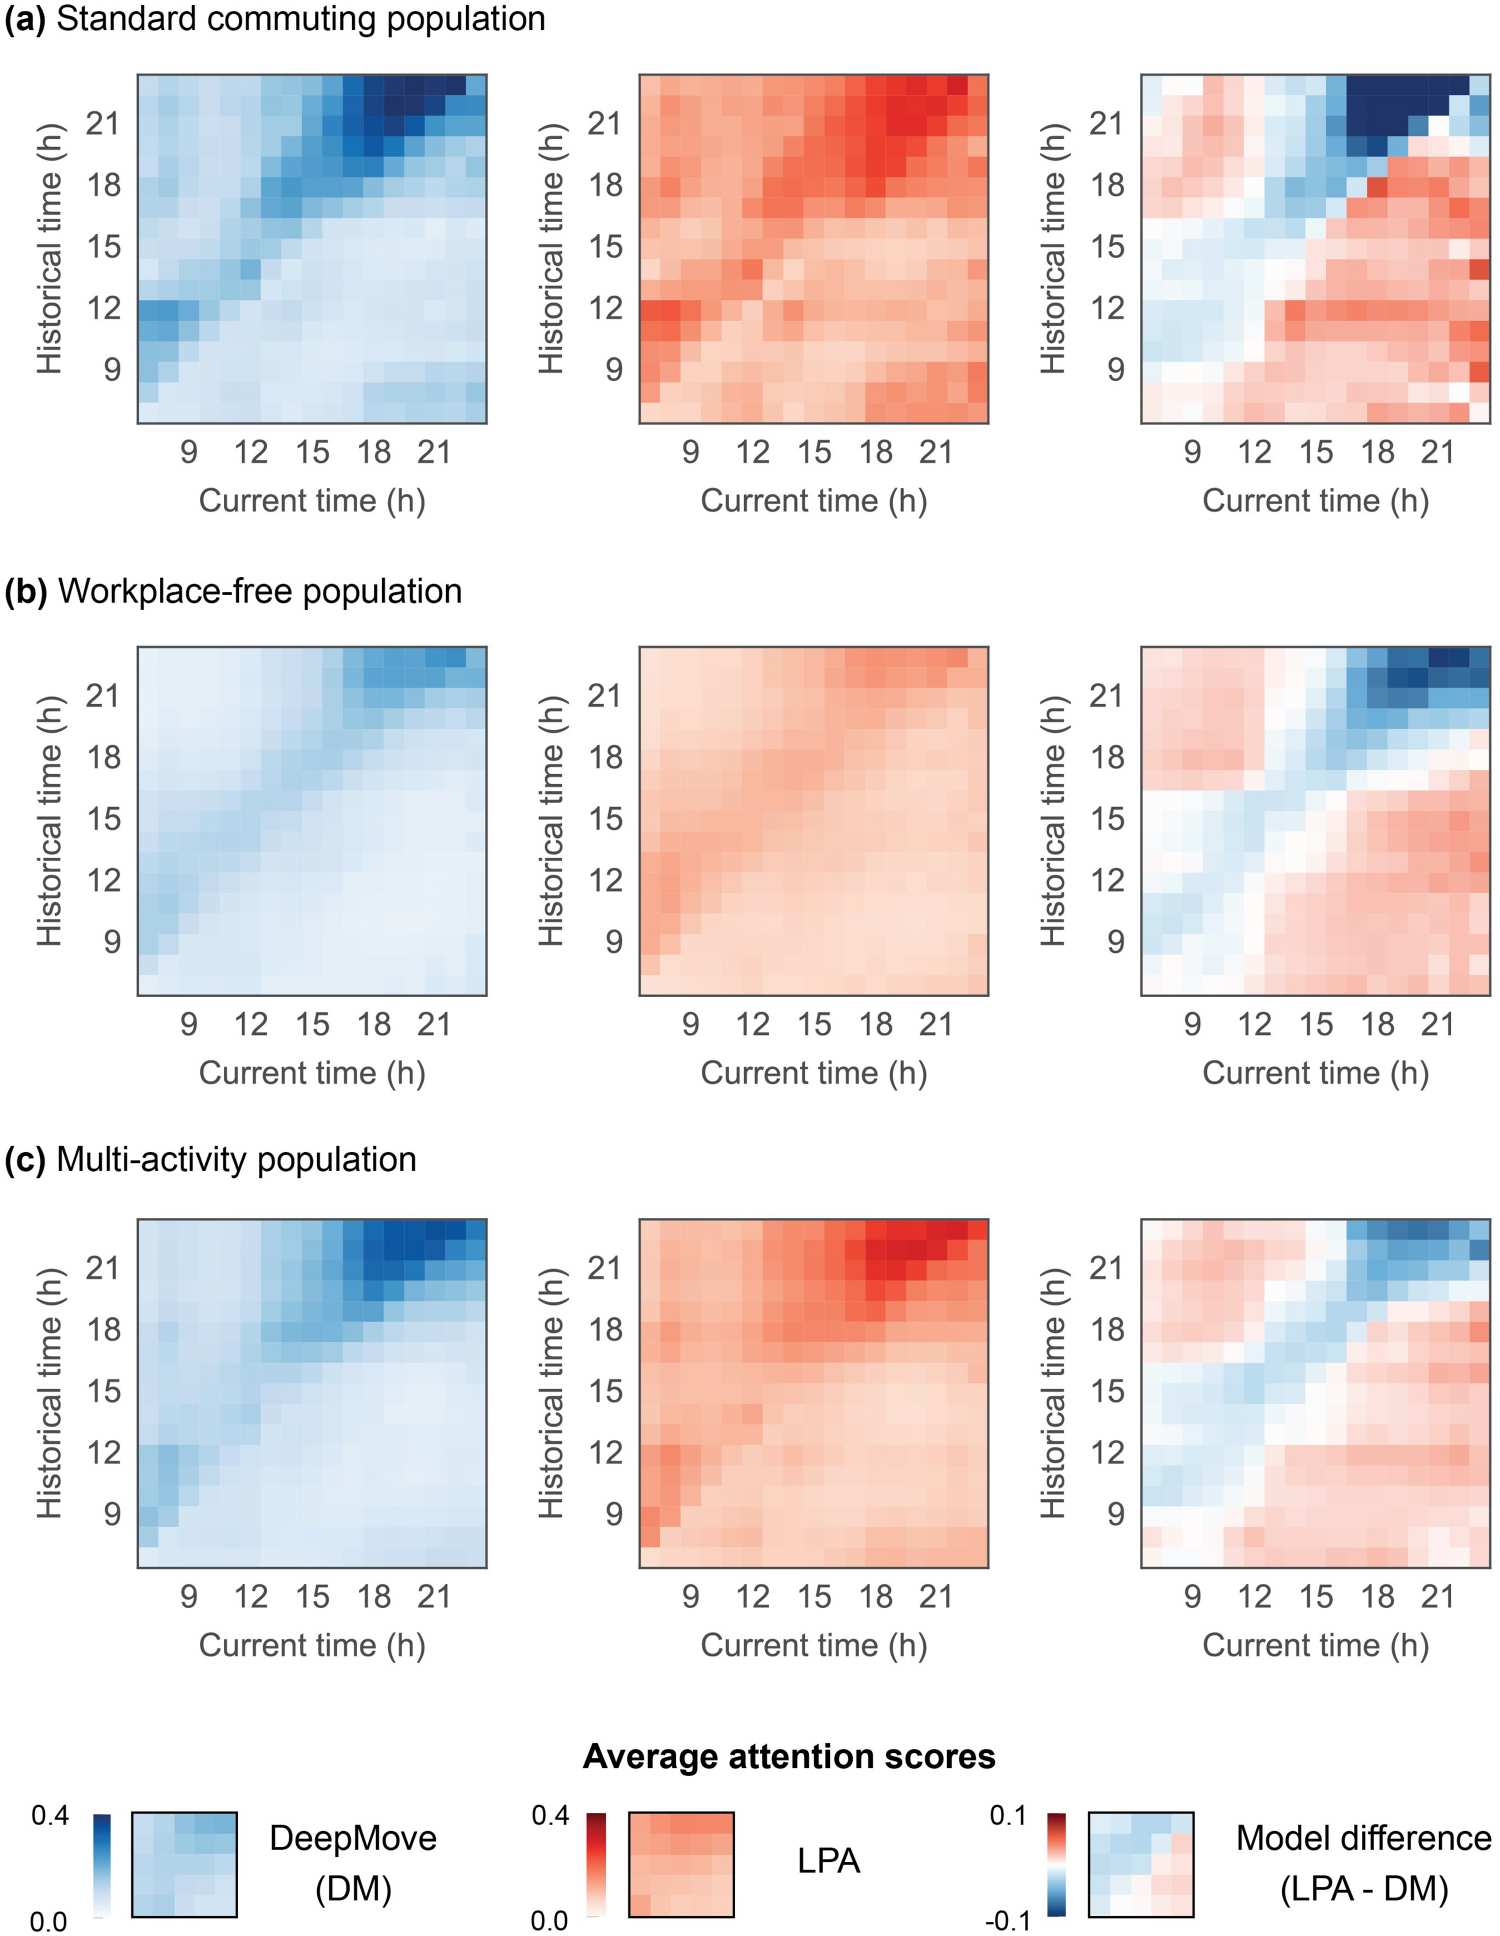
To gain deeper insight into the effects of activity semantics on next location prediction, we visualize the
attention scores of DeepMove (blue) and LPA (red) and the differences between them (gradient from
blue to red) for three user groups. Attention scores indicate the relative importance the model assigns to
different points in the historical trajectory when predicting the next location, reflecting how much influence
these points have on the prediction.
As illustrated in Figure 5, both models generally show pronounced diagonal attention patterns across all
the user groups. This indicates the models’ preference for the same hours on previous days when predicting
the next location. For the standard commuting population (Figure 5(a)), these diagonals are particularly
strong during morning and evening peak hours. This finding demonstrates that the models can capture
the highly regular temporal structure of commuting behavior. After integrating activity semantics, the
LPA model reduces attention to nighttime hours when predicting after the evening peak hours and
increases attention to noon hours when predicting afternoon movements. This shift suggests that activity
semantics guide the model towards more contextually relevant historical information rather than relying
solely on temporal proximity.
In Figure 5(b), the workplace-free population exhibits a flatter and more uniformly distributed attention
pattern, reflecting the group’s diverse and less temporally structured activity routines. Without fixed workplace constraints, these users’ movement patterns deviate from typical commuting behaviors. After integrating activity semantics, the model increases attention to complementary time periods from previous days (i.e.
earlier time windows when predicting later-day locations). This demonstrates an adaptive strategy to extract
broader contextual cues in the absence of strong temporal regularity.
The heatmap for the multi-activity population (Figure 5(c)) reveals a hybrid attention pattern. High
attention concentrations appear along diagonals during morning (approximately 9:00) and evening
hours (18:00–21:00). This may indicate that the model can recognize the structured commuting components (e.g. work-related travel). However, different from the standard commuting population, these diagonal patterns weaken during midday periods, suggesting greater variability in non-mandatory activities.
With activity semantics integration, the LPA model preserves the focus on the structurally significant transition periods while redistributing attention more flexibly during midday hours. Overall, these results
demonstrate that the integration of activity semantics enhances the ability of the LPA model to trace meaningful temporal patterns in historical trajectories, which helps to improve its contextual understanding and
predictive performance across different user groups.
Figure 5. Attention scores assigned to historical trajectories across users with different daily travel patterns.
#### 5.2.3. Effects of historical trajectory length on next location prediction
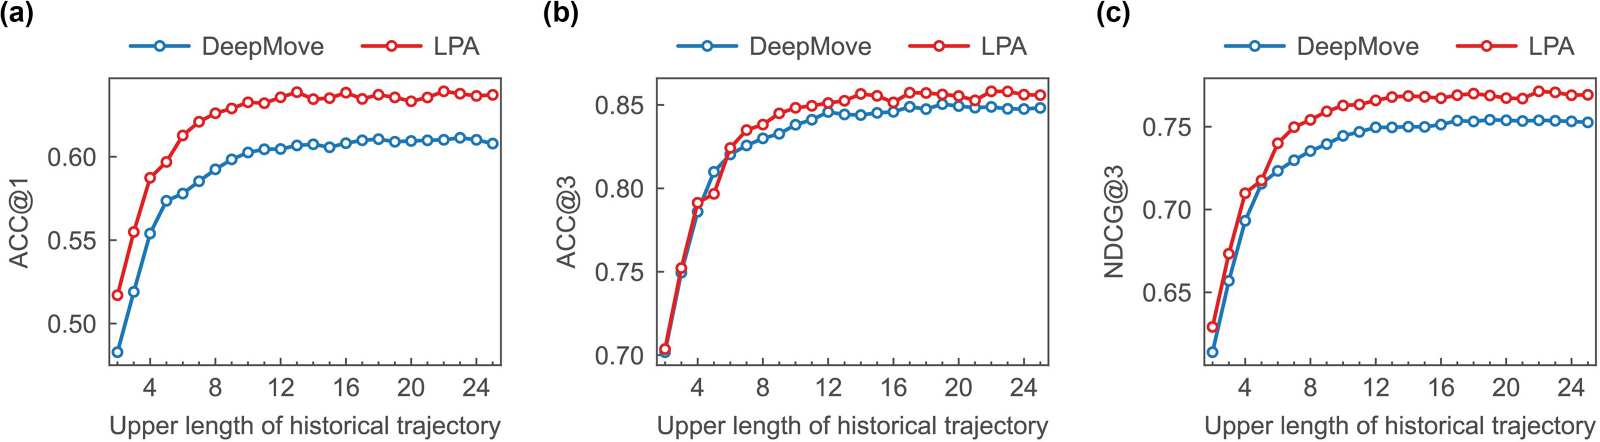
Next, to evaluate the improvement gained by integrating activity semantics across varying historical context
lengths, we analyze the relationship between the length of historical trajectories and the prediction performance of the LPA and DeepMove models. Since both models utilize an attention mechanism to extract key
patterns inherent in historical trajectories, we specifically examine how the upper limit of trajectory length
used in the attention module affects next location prediction. The analysis tests the prediction performance
for historical contexts ranging from 2 to 25 records.
As expected, the prediction performance improves with longer trajectory sequences provided, as the
models benefit from the additional context. As shown in Figure 6, both models exhibit this trend; however,
the LPA model consistently outperforms DeepMove by over 4% in terms of ACC@1. This result suggests
that the integration of activity semantics enables the model to achieve higher prediction accuracy regardless
of the length of the historical context. In contrast, for ACC@3 and NDCG@3, the improvements of the LPA
model are limited when the historical trajectory length is shorter than six records. The impact of activity
semantics becomes more pronounced with longer trajectories. This is possibly because longer sequences
could provide richer semantic context, which enables the model to better capture activity patterns in complex trajectories. In contrast, shorter sequences, such as those in ‘cold start’ scenarios, offer limited semantic
insights due to insufficient movement records.
Figure 6. Prediction performance across different upper length of historical trajectory.
Furthermore, the LPA model shows greater improvements in NDCG@3 than in ACC@3, indicating
enhanced ranking quality among the top three predicted location candidates. Finally, the performance of
both models stabilizes once the limited length of the historical trajectory exceeds 12 records. This suggests
that additional historical data beyond this point offer limited benefit, as the model has possibly already captured the typical mobility patterns of users.
#### 5.2.4. Effects of activity integration strategies on next location prediction
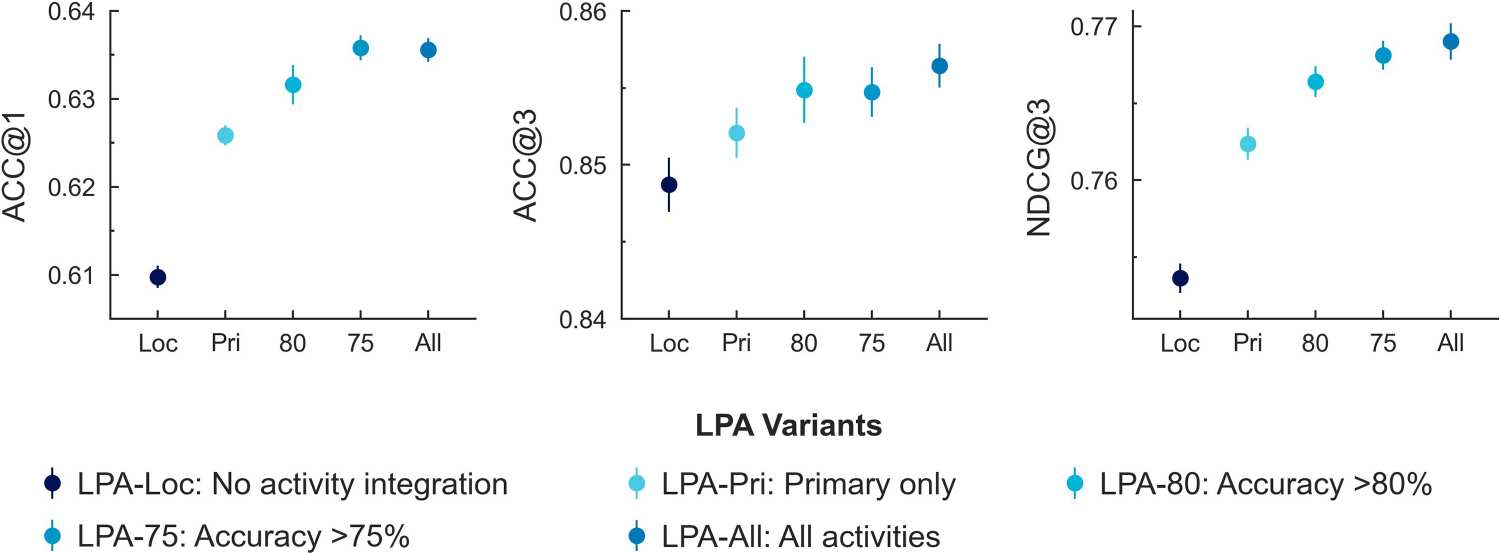
To evaluate how different activity integration strategies affect the next location prediction performance, we
compare models that integrate varying ranges of activity types. To achieve this, we incrementally expand the
activity types incorporated into the LPA model. This results in five variants for comparative evaluation:
- **LPA-Loc:** This variant excludes all activity information and uses location data only (serving as the baseline).
- **LPA-Pri:** This variant uses only primary activities (home and work).
- **LPA-80:** This variant integrates only activities with an inference accuracy of 80% or higher (home, work, and eat out). Activities with lower inference are treated as ‘unknown’.
- **LPA-75:** This variant integrates activities with >75% inference accuracy (home, work, eat out, and personal affairs), with activities falling below 75% treated as ‘unknown’.
- **LPA-All:** This variant integrates all inferred activity types, including shopping and leisure activities, regardless of their individual inference accuracy.
As shown in Figure 7, integrating activity semantics consistently improves the prediction performance
across all the evaluation metrics, even when the inferred activity labels are not perfectly accurate. Taking
ACC@1 as an example, integrating only primary activities (LPA-Pri) increases the accuracy from
approximately 0.61 (LPA-Loc) to over 0.625. As additional activity types with an inference accuracy
threshold of 80% are added (e.g. LPA-80 includes eat out activities in addition to primary activities),
ACC@1 further improves to above 0.63. This trend continues for LPA-75 and LPA-All, which integrate
more types of activity. A similar trend is observed for ACC@3 and NDCG@3, where the performance steadily improves from LPA-Loc to LPA-All. These results highlight that incorporating a wider range of activity
semantics generally yields better predictive performance. These findings suggest that the proposed model is
robust to inference errors and can effectively utilize activity information even when inference accuracy varies across activity types.
Figure 7. Overall performance of LPA with different activities integration strategies.
## 6. Conclusion
This study presents a semantics-enhanced next location prediction framework that infers and integrates user activities into an LSTM architecture with attention mechanisms and multimodal embeddings. Our results demonstrate that integrating six types of inferred activities (home, work, and four
key non-mandatory activities) substantially improves prediction accuracy, particularly for mobile
phone users with stable daily routines and those with longer trajectory histories. The findings highlight the value of enriching trajectory data with activity-level context, which enables models to better capture the behavioral motivations behind movement. Notably, while home and work activities
can be reliably inferred, non-mandatory activities remain more difficult to identify due to their irregularity. Nevertheless, our current experiment demonstrates that integrating a broader range of
non-mandatory activity types contributes more to improving prediction accuracy than relying solely
on a smaller set of highly accurate activities. If the inference accuracy of non-mandatory activities
can be improved in the future, the predictive performance of such models is expected to further
improve.
We plan to improve our approach in several ways. First, we currently use a learnable embedding matrix
to represent activity sequences to facilitate integration with the LSTM-based model. It would be valuable to
explore more advanced representations of activity sequences and evaluate how different representations
affect next location prediction performance. Second, we plan to test the performance of the proposed
approach using datasets from different cities to assess its robustness and adaptability across diverse
urban contexts. While the current evaluation of mobile phone data from Guangzhou has yielded promising
results, we acknowledge that the single-city scope limits the generalizability of our findings. Although we
have simulated variations in mobility behaviors through analyses across different user groups within the
city, future work involving cross-city or cross-region datasets is essential to fully validate the model’s
transferability.
## Geolocation information
The study area in this paper is Guangzhou city, China.
## Disclosure statement
No potential conflict of interest was reported by the author(s).
## Funding
This work was supported by National Natural Science Foundation of China [grant number 41971345] and Guangdong
Basic and Applied Basic Research Foundation [grant number 2025A1515010994].
## Data availability statement
We provided sample data and codes to make our research reproducible, accessed in GitHub ([https://github.com/nehSgnaiL/LPA/](https://github.com/nehSgnaiL/LPA/)). The travel survey data and mobile phone data in Guangzhou, China are not available due to confidentiality agreements.
## References
- Chen, T., and C. Guestrin. 2016. “XGBoost: A Scalable Tree Boosting System.” In Proceedings of the 22nd ACM SIGKDD International Conference on Knowledge Discovery and Data Mining, edited by B. Krishnapuram, M. Shah, A. Smola, C. Aggarwal, D. Shen, and R. Rastogi, 785–794. New York, NY: Association for Computing Machinery. [https://doi.org/10.1145/2939672.2939785](https://doi.org/10.1145/2939672.2939785).
- Chen, Y., N. Xie, H. Xu, X. Chen, and D. H. Lee. 2024a. “A Multi-context Aware Human Mobility Prediction Model Based on Motif-Preserving Travel Preference Learning.” IEEE Transactions on Intelligent Transportation Systems 25 (2): 2139–2152. [https://doi.org/10.1109/TITS.2023.3314281](https://doi.org/10.1109/TITS.2023.3314281).
- Chen, Y., P. Zhao, Y. Lin, Y. Sun, R. Chen, L. Yu, and Y. Liu. 2024b. “Semantic-enhanced Graph Convolutional Neural Networks for Multi-scale Urban Functional-Feature Identification Based on Human Mobility.” ISPRS International Journal of Geo-Information 13 (1): 27. [https://doi.org/10.3390/ijgi13010027](https://doi.org/10.3390/ijgi13010027).
- Choi, S., H. Yeo, and J. Kim. 2018. “Network-wide Vehicle Trajectory Prediction in Urban Traffic Networks Using Deep Learning.” Transportation Research Record: Journal of the Transportation Research Board 2672 (45): 173–184. [https://doi.org/10.1177/0361198118794735](https://doi.org/10.1177/0361198118794735).
- Defferrard, M., X. Bresson, and P. Vandergheynst. 2016. “Convolutional Neural Networks on Graphs with Fast Localized Spectral Filtering.” In Proceedings of the 30th International Conference on Neural Information Processing Systems, 3844–3852. [https://doi.org/10.5555/3157382.3157527](https://doi.org/10.5555/3157382.3157527).
- Diao, M., Y. Zhu, J. Ferreira, and C. Ratti. 2016. “Inferring Individual Daily Activities from Mobile Phone Traces: A Boston Example.” Environment and Planning B: Planning and Design 43 (5): 920–940. [https://doi.org/10.1177/0265813515600896](https://doi.org/10.1177/0265813515600896).
- Ermagun, A., Y. Fan, J. Wolfson, G. Adomavicius, and K. Das. 2017. “Real-time Trip Purpose Prediction Using Online Location-Based Search and Discovery Services.” Transportation Research Part C: Emerging Technologies 77:96–112. [https://doi.org/10.1016/j.trc.2017.01.020](https://doi.org/10.1016/j.trc.2017.01.020).
- Feng, J., Y. Li, Z. Yang, Q. Qiu, and D. Jin. 2022. “Predicting Human Mobility with Semantic Motivation via Multi-task Attentional Recurrent Networks.” IEEE Transactions on Knowledge and Data Engineering 34 (5): 2360–2374. [https://doi.org/10.1109/TKDE.2020.3006048](https://doi.org/10.1109/TKDE.2020.3006048).
- Feng, J., Y. Li, C. Zhang, F. Sun, F. Meng, A. Guo, and D. Jin. 2018. “DeepMove: Predicting Human Mobility with Attentional Recurrent Networks.” In Proceedings of the 2018 World Wide Web Conference, edited by P.-A. Champin, F. Gandon, L. Médini, M. Lalmas, and P. G. Ipeirotis, 1459–1468. Republic and Canton of Geneva, Switzerland: International World Wide Web Conferences Steering Committee. [https://doi.org/10.1145/3178876.3186058](https://doi.org/10.1145/3178876.3186058).
- Gong, L., X. Liu, L. Wu, and Y. Liu. 2016. “Inferring Trip Purposes and Uncovering Travel Patterns from Taxi Trajectory Data.” Cartography and Geographic Information Science 43 (2): 103–114. [https://doi.org/10.1080/15230406.2015.1014424](https://doi.org/10.1080/15230406.2015.1014424).
- Hawalah, A., and M. Fasli. 2014. “Utilizing Contextual Ontological User Profiles for Personalized Recommendations.” Expert Systems with Applications 41 (10): 4777–4797. [https://doi.org/10.1016/j.eswa.2014.01.039](https://doi.org/10.1016/j.eswa.2014.01.039).
- He, S., W. Du, Y. Zhang, L. Chen, Z. Chen, and N. Chen. 2024. “Next Location Prediction Using Heterogeneous Graph-Based Fusion Network with Physical and Social Awareness.” International Journal of Geographical Information Science 38 (10): 1965–1990. [https://doi.org/10.1080/13658816.2024.2375725](https://doi.org/10.1080/13658816.2024.2375725).
- Hong, Y., H. Martin, and M. Raubal. 2022, November. “How Do You Go Where? Improving Next Location Prediction by Learning Travel Mode Information Using Transformers.” In SIGSPATIAL’22: Proceedings of the 30th International Conference on Advances in Geographic Information Systems, edited by M. Renz and M. Sarwat, 1–10. New York, NY: Association for Computing Machinery.
- Hu, Y., and Y. Han. 2019. “Identification of Urban Functional Areas Based on POI Data: A Case Study of the Guangzhou Economic and Technological Development Zone.” Sustainability 11 (5): 1385. [https://doi.org/10.3390/su11051385](https://doi.org/10.3390/su11051385).
- Hu, Z., W. Wang, Z. Huang, J. Yang, T. Yang, Y. Jin, and Y. Xu. 2025. “TrajGEOS: Trajectory Graph Enhanced Orientation-Based Sequential Network for Mobility Prediction.” IEEE Transactions on Computational Social Systems : 1–14. [https://doi.org/10.1109/TCSS.2025.3559875](https://doi.org/10.1109/TCSS.2025.3559875).
- Huang, H., X. A. Yao, J. M. Krisp, and B. Jiang. 2021. “Analytics of Location-Based big Data for Smart Cities: Opportunities, Challenges, and Future Directions.” Computers, Environment and Urban Systems 90:101712. [https://doi.org/10.1016/j.compenvurbsys.2021.101712](https://doi.org/10.1016/j.compenvurbsys.2021.101712).
- Huang, Q. 2017. “Mining Online Footprints to Predict User’s Next Location.” International Journal of Geographical Information Science 31 (3): 523–541. [https://doi.org/10.1080/13658816.2016.1209506](https://doi.org/10.1080/13658816.2016.1209506).
- Huang, W., and S. Li. 2019. “An Approach for Understanding Human Activity Patterns with the Motivations Behind.” International Journal of Geographical Information Science 33 (2): 385–407. [https://doi.org/10.1080/13658816.2018.1530354](https://doi.org/10.1080/13658816.2018.1530354).
- Huang, W., S. Li, X. Liu, and Y. Ban. 2015. “Predicting Human Mobility with Activity Changes.” International Journal of Geographical Information Science 29 (9): 1569–1587. [https://doi.org/10.1080/13658816.2015.1033421](https://doi.org/10.1080/13658816.2015.1033421).
- Huang, Z., X. Ling, P. Wang, F. Zhang, Y. Mao, T. Lin, and F. Y. Wang. 2018. “Modeling Real-Time Human Mobility Based on Mobile Phone and Transportation Data Fusion.” Transportation Research Part C: Emerging Technologies 96:251–269. [https://doi.org/10.1016/j.trc.2018.09.016](https://doi.org/10.1016/j.trc.2018.09.016).
- Ji, S., X. Wang, T. Lyu, X. Liu, Y. Wang, E. Heinen, and Z. Sun. 2022. “Understanding Cycling Distance according to the Prediction of the XGBoost and the Interpretation of SHAP: A non-linear and Interaction Effect Analysis.” Journal of Transport Geography 103:103414. [https://doi.org/10.1016/j.jtrangeo.2022.103414](https://doi.org/10.1016/j.jtrangeo.2022.103414).
- Jin, K., X. Li, W. Wang, X. Hua, and S. Qin. 2022. “When and Where to go Next: Deep Learning Framework for Modeling Drivers’ Behaviors Using Automatic Vehicle Identification Data.” Transportation Research Record: Journal of the Transportation Research Board 2676 (6): 387–398. [https://doi.org/10.1177/03611981221074372](https://doi.org/10.1177/03611981221074372).
- Karatzoglou, A., A. Jablonski, and M. Beigl. 2018. “A Seq2Seq Learning Approach for Modeling Semantic Trajectories and Predicting the Next Location.” In Proceedings of the 26th ACM SIGSPATIAL International Conference on Advances in Geographic Information Systems, edited by F. Banaei-Kashani, E. Hoel, R. H, Güting, R. Tamassia, and L. Xiong, 528–531. New York, NY: Association for Computing Machinery. [https://doi.org/10.1145/3274895.3274983](https://doi.org/10.1145/3274895.3274983).
- Li, M., F. Lu, H. Zhang, and J. Chen. 2020. “Predicting Future Locations of Moving Objects with Deep Fuzzy-LSTM Networks.” Transportmetrica A: Transport Science 16 (1): 119–136. [https://doi.org/10.1080/23249935.2018.1552334](https://doi.org/10.1080/23249935.2018.1552334).
- Li, Q., D. Zou, and Y. Xu. 2022. “Combining Individual Travel Behaviour and Collective Preferences for Next Location Prediction.” Transportmetrica A: Transport Science 18 (3): 1754–1776. [https://doi.org/10.1080/23249935.2021.1968066](https://doi.org/10.1080/23249935.2021.1968066).
- Li, X., D. Lian, X. Xie, and G. Sun. 2015. November 14–17. “Lifting the Predictability of Human Mobility on Activity Trajectories. In IEEE International Conference on Data Mining Workshops (ICDM Workshops), edited by X. Wu, A. Tuzhilin, H. Xiong, J. G. Dy, C. Aggarwal, Z.-H. Zhou, and P. Cui, Atlantic City, NJ: Institute of Electrical and Electronics Engineers Inc. [https://doi.org/10.1109/ICDMW.2015.164](https://doi.org/10.1109/ICDMW.2015.164).
- Liao, C. 2023. “Enriching Large-Scale Trips with Fine-Grained Travel Purposes: A Semi-supervised Deep Graph Embedding Framework.” IEEE Transactions on Intelligent Transportation Systems 24 (11): 13228–13239. [https://doi.org/10.1109/TITS.2022.3203464](https://doi.org/10.1109/TITS.2022.3203464).
- Liao, D., Y. Zhong, and J. Li. 2017. “Location Prediction through Activity Purpose: Integrating Temporal and Sequential Models.” In Advances in Knowledge Discovery and Data Mining: 21st Pacific-Asia Conference, PAKDD 2017, edited by J. Kim, K. Shim, L. Cao, J.-G. Lee, X. Lin, and Y.-S. Moon, 711–723. Cham: Springer Cham. [https://doi.org/10.1007/978-3-319-57454-7_55](https://doi.org/10.1007/978-3-319-57454-7_55).
- Liu, C., S. Gong, H. Su, J. Chen, H. Guo, J. He, C. Jing, and Y. Liu. 2024. “Integrating Trajectory Data and Demographic Characteristics: A Trajectory Semantic Model for Predicting Travel Flow and Conducting Interaction Analysis.” International Journal of Digital Earth 17 (1): 1–29. [https://doi.org/10.1080/17538947.2024.2392842](https://doi.org/10.1080/17538947.2024.2392842).
- Liu, H., J. Wang, J. Liu, et al. 2023. “Combined and Delayed Impacts of Epidemics and Extreme Weather on Urban Mobility Recovery.” Sustainable Cities and Society 99 (8): 104872. [https://doi.org/10.1016/j.scs.2023.104872](https://doi.org/10.1016/j.scs.2023.104872)
- Long, W., T. Li, Z. Xiao, D. Wang, and R. Zhang. 2022. “Location Prediction for Individual Vehicles via Exploiting Travel Regularity and Preference.” IEEE Transactions on Intelligent Transportation Systems 71 (5): 4718–4732. [https://doi.org/10.1109/TVT.2022.3151762](https://doi.org/10.1109/TVT.2022.3151762).
- Luca, M., G. Barlacchi, B. Lepri, and L. Pappalardo. 2023. “A Survey on Deep Learning for Human Mobility.” ACM Computing Surveys 55 (1): 1–44. [https://doi.org/10.1145/3485125](https://doi.org/10.1145/3485125).
- Luo, Y., Z. Cao, X. Jin, K. Liu, and L. Yin. 2024. “Deciphering Human Mobility: Inferring Semantics of Trajectories with Large Language Models,” 289–294. [https://doi.org/10.1109/MDM61037.2024.00060](https://doi.org/10.1109/MDM61037.2024.00060).
- Mahdizadeh, M. S., and B. Bahrak. 2020. “A Regression Framework for Predicting User’s Next Location Using Call Detail Records.” Computer Networks 183:107618. [https://doi.org/10.1016/j.comnet.2020.107618](https://doi.org/10.1016/j.comnet.2020.107618)
- Mo, B., Z. Zhao, H. N. Koutsopoulos, and J. Zhao. 2022. “Individual Mobility Prediction in Mass Transit Systems Using Smart Card Data: An Interpretable Activity-Based Hidden Markov Approach.” IEEE Transactions on Intelligent Transportation Systems 23 (8): 12014–12026. [https://doi.org/10.1109/TITS.2021.3109428](https://doi.org/10.1109/TITS.2021.3109428).
- Okmi, M., L. Y. Por, T. F. Ang, W. Al-Hussein, and C. S. Ku. 2023. “A Systematic Review of Mobile Phone Data in Crime Applications: A Coherent Taxonomy Based on Data Types and Analysis Perspectives, Challenges, and Future Research Directions.” Sensors 23 (9): 4350. [https://doi.org/10.3390/s23094350](https://doi.org/10.3390/s23094350).
- Parsa, B., A. Movahedi, H. Taghipour, S. Derrible, and A. Mohammadian. 2020. “Toward Safer Highways, Application of XGBoost and SHAP for Real-Time Accident Detection and Feature Analysis.” Accident Analysis & Prevention 136:105405. [https://doi.org/10.1016/j.aap.2019.105405](https://doi.org/10.1016/j.aap.2019.105405).
- Qiao, Y., Z. Si, Y. Zhang, F. B. Abdesslem, X. Zhang, and J. Yang. 2018. “A Hybrid Markov-Based Model for Human Mobility Prediction.” Neurocomputing 278:99–109. [https://doi.org/10.1016/j.neucom.2017.05.101](https://doi.org/10.1016/j.neucom.2017.05.101)
- Rendle, S., C. Freudenthaler, and L. Schmidt-Thieme. 2010. “Factorizing Personalized Markov Chains for Next-Basket Recommendation.” In Proceedings of the 19th International Conference on World Wide Web, edited by M. Rappa, P. Jones, J. Freire, S. Chakrabarti, 811–820. New York, NY: Association for Computing Machinery. [https://doi.org/10.1145/1772690.1772773](https://doi.org/10.1145/1772690.1772773).
- Shaw, S.-L., and D. Sui. 2018. “Editorial: GIScience for Human Dynamics Research in a Changing World.” Transactions in GIS 22 (4): 891–899. [https://doi.org/10.1111/tgis.12474](https://doi.org/10.1111/tgis.12474).
- Shen, X., W. Shi, P. Chen, Z. Liu, and L. Wang. 2022. “Novel Model for Predicting Individuals’ Movements in Dynamic Regions of Interest.” GIScience & Remote Sensing 59 (1): 250–271. [https://doi.org/10.1080/15481603.2022.2026637](https://doi.org/10.1080/15481603.2022.2026637).
- Shi, Q., L. Zhuo, H. Tao, and Q. Li. 2022. “Mining Hourly Population Dynamics by Activity Type Based on Decomposition of Sequential Snapshot Data.” International Journal of Digital Earth 15 (1): 1395–1416. [https://doi.org/10.1080/17538947.2022.2110290](https://doi.org/10.1080/17538947.2022.2110290).
- Solomon, A., A. Livne, G. Katz, B. Shapira, and L. Rokach. 2021. “Analyzing Movement Predictability Using Human Attributes and Behavioral Patterns.” Computers, Environment and Urban Systems 87 (2): 101596. [https://doi.org/10.1016/j.compenvurbsys.2021.101596](https://doi.org/10.1016/j.compenvurbsys.2021.101596)
- Sutskever, I., J. Martens, and G. E. Hinton. 2011. “Generating Text with Recurrent Neural Networks.” In Proceedings of the 28th International Conference on Machine Learning (ICML), edited by L. Getoor and T. Scheffer, 1017–1024. Madison, WI: Omnipress.
- Toch, E., B. Lerner, E. Ben-Zion, and I. Ben-Gal. 2019. “Analyzing Large-Scale Human Mobility Data: A Survey of Machine Learning Methods and Applications.” Knowledge and Information Systems 58 (3): 501–523. [https://doi.org/10.1007/s10115-018-1186-x](https://doi.org/10.1007/s10115-018-1186-x).
- Tu, W., J. Cao, Y. Yue, S. L. Shaw, M. Zhou, Z. Wang, X. Chang, Y. Xu, and Q. Li. 2017. “Coupling Mobile Phone and Social Media Data: A new Approach to Understanding Urban Functions and Diurnal Patterns.” International Journal of Geographical Information Science 31 (12): 2331–2358. [https://doi.org/10.1080/13658816.2017.1356464](https://doi.org/10.1080/13658816.2017.1356464).
- Wang, B., H. Li, W. Wang, M. Wang, Y. Jin, and Y. Xu. 2024. “PG² Net: Personalized and Group Preferences Guided Network for Next Place Prediction.” IEEE Transactions on Intelligent Transportation Systems 25 (8): 8655–8670. [https://doi.org/10.1109/TITS.2024.3355292](https://doi.org/10.1109/TITS.2024.3355292)
- Xu, S., J. Cao, P. Legg, B. Liu, and S. Li. 2020. “Venue2Vec: An Efficient Embedding Model for Fine-Grained User Location Prediction in geo-Social Networks.” IEEE Systems Journal 14 (2): 1740–1751. [https://doi.org/10.1109/JSYST.2019.2913080](https://doi.org/10.1109/JSYST.2019.2913080).
- Xu, Y., X. Li, S. L. Shaw, F. Lu, L. Yin, and B. Y. Chen. 2021. “Effects of Data Preprocessing Methods on Addressing Location Uncertainty in Mobile Signaling Data.” Annals of the American Association of Geographers 111 (2): 515–539. [https://doi.org/10.1080/24694452.2020.1773232](https://doi.org/10.1080/24694452.2020.1773232).
- Xu, Y., S. L. Shaw, Z. Zhao, L. Yin, Z. Fang, and Q. Li. 2015. “Understanding Aggregate Human Mobility Patterns Using Passive Mobile Phone Location Data: A Home-Based Approach.” Transportation 42 (4): 625–646. [https://doi.org/10.1007/s11116-015-9597-y](https://doi.org/10.1007/s11116-015-9597-y).
- Yabe, T., N. K. W. Jones, P. S. C. Rao, M. C. Gonzalez, and S. V. Ukkusuri. 2022. “Mobile Phone Location Data for Disasters: A Review from Natural Hazards and Epidemics.” Computers, Environment and Urban Systems 94:101777. [https://doi.org/10.1016/j.compenvurbsys.2022.101777](https://doi.org/10.1016/j.compenvurbsys.2022.101777).
- Yang, S., J. Liu, and K. Zhao. 2022. “Getnext: Trajectory Flow map Enhanced Transformer for Next poi Recommendation.” In Proceedings of the 45th International ACM SIGIR Conference on Research and Development in Information Retrieval, edited by E. Amigo, P. Castells, J. Gonzalo, B. Carterette, J. S. Culpepper, G. Kazai, 1144–1153. New York: Association for Computing Machinery.
- Yao, D., C. Zhang, J. Huang, and J. Bi. 2017. “SERM: A Recurrent Model for Next Location Prediction in Semantic Trajectories.” In Proceedings of the 2017 ACM on Conference on Information and Knowledge Management, E.-P. Lim, M. Winslett, M. Sanderson, A. Fu, J. Sun, S. Culpepper, E. Lo, J. Ho, D. Donato, R. Agrawal, Y. Zheng, C. Castillo, A. Sun, V. S. Tseng, and C. Li, 2411–2414. New York: Association for Computing Machinery. [https://doi.org/10.1145/3132847.3133056](https://doi.org/10.1145/3132847.3133056).
- Yin, L., N. Lin, and Z. Zhao. 2021. “Mining Daily Activity Chains from Large-Scale Mobile Phone Location Data.” Cities 109:103013. [https://doi.org/10.1016/j.cities.2020.103013](https://doi.org/10.1016/j.cities.2020.103013).
- Yu, C., Y. Liu, D. Yao, L. T. Yang, H. Jin, H. Chen, and Q. Ding. 2017. “Modeling User Activity Patterns for Next-Place Prediction.” IEEE Systems Journal 11 (2): 1060–1071. [https://doi.org/10.1109/JSYST.2015.2445919](https://doi.org/10.1109/JSYST.2015.2445919).
- Yuan, M. 2018. “Human Dynamics in Space and Time: A Brief History and a View Forward.” Transactions in GIS 22 (4): 900–912. [https://doi.org/10.1111/tgis.12473](https://doi.org/10.1111/tgis.12473).
- Zhu, Y. 2022. “Inference of Activity Patterns from Urban Sensing Data Using Conditional Random Fields.” Environment and Planning B: Urban Analytics and City Science 49 (2): 549–565. [https://doi.org/10.1177/23998083211016863](https://doi.org/10.1177/23998083211016863).
- Zou, D., Q. Li, Y. Zhou, S. Liang, and S. Zhou. 2025. ‘Understanding Factors Associated with Individuals’ non-Mandatory Activities Using Machine Learning and SHAP Interpretation: A Case Study of Guangzhou, China.’ Travel Behaviour and Society 38:100894. [https://doi.org/10.1016/j.tbs.2024.100894](https://doi.org/10.1016/j.tbs.2024.100894).