Predicting short-term urban bike sharing demand in a coupled continuous and network space
- This HTML version is provided to help readers discover, access, and evaluate the work.
- It (licensed under CC BY-NC-ND 4.0) was generated by an automated system from the author-accepted manuscript.
- Official publication at https://doi.org/10.1016/j.tbs.2025.101152.
Table of contents
- Abstract
- 1. Introduction
- 2. Literature review
- 2.1. Predicting bike sharing demand: Models and solutions
- 2.2. The need to predict bike sharing demand in a coupled continuous and network space
- 3. Study area and dataset
- 4. Methodology
- 4.1. Overall structure of GeoTopo-Net
- 4.2. Capturing spatial dependency in a coupled continuous and network space
- 4.3. Modeling temporal dependency and fusing spatiotemporal features
- 4.4. Training and evaluating GeoTopo-Net
- 5. Analysis results
- 5.1. Overall performance of GeoTopo-Net
- 5.2. Performance improvement after integrating topological dependency in urban networks
- 5.3. Spatial patterns of prediction improvements from metro network integration
- 6. Discussion and conclusion
- Declaration of Generative AI and AI-assisted technologies in the writing process
- CRediT authorship contribution statement
- Declaration of competing interest
- Acknowledgement
- Appendix A. Supplementary data
- References
Abstract
Bike sharing systems support sustainable urban development, with accurate demand prediction being essential for efficient operations. Previous studies have primarily modeled spatial dependency of bike sharing demand in Euclidean space or among bike stations, but often overlooked topological dependency of demand shaped by urban transportation networks. Metro and cycling networks could influence bike sharing usage through their functional connections with bike sharing systems. To address this gap, this study proposes GeoTopo-Net, a novel deep learning framework to improve short-term demand forecast for urban bike sharing systems. Different from existing solutions, GeoTopo-Net jointly models dependencies of travel demand in both continuous and network spaces. The model utilizes convolutional neural networks (CNNs) to capture spatial dependency between urban areas and their surroundings, while integrating graph convolutional networks (GCNs) to model the topological dependency introduced by urban transportation networks. Our evaluation across five global cities shows that GeoTopo-Net significantly reduces prediction errors, by up to 8.9% in RMSE, 6.8% in MAE, and 5.9% in MAPE. Incorporating dependencies from metro networks produces notable improvements in high-demand areas and those near the metro stations. These findings highlight the importance of incorporating urban transportation network structures in bike sharing demand forecast. The GeoTopo-Net architecture can also be adapted to improve short-term forecast for different types of travel demand (e.g., ride-hailing; electric vehicle charging demand) that involve complex interdependencies in continuous and network spaces.
Keywords: Shared mobility; Bike sharing; Deep learning; Urban network; Demand forecast
1. Introduction
Bike sharing systems have become increasingly popular in modern cities due to their convenient access and associated environmental benefits (Fosgerau et al., 2023; Gao et al., 2021; Mi and Coffman, 2019; Saltykova et al., 2022; Zhuang et al., 2025). As a potential solution for enhancing first- and last-mile connections, bike sharing links daily activity spaces with public transit systems for urban dwellers while offering new options for leisure and recreation. However, reckless expansion of shared bikes often poses challenges for management of these systems. Accurate prediction of short-term bike sharing demand is therefore crucial for fleet rebalancing and inventory management (Gammelli et al., 2022; Hulot et al., 2018).
Accurate prediction of bike sharing demand relies on understanding the spatiotemporal characteristics of travel demand and potential influencing factors. Temporal dependency, which refers to the relationship between demand patterns across different time periods, can be observed from bike sharing systems to understand how past travel patterns influence future demand. Therefore, many studies have employed statistical and machine learning models to capture the temporal dependency to fulfill the prediction tasks (Chen et al., 2024; Kaltenbrunner et al., 2010). However, these models often do not incorporate spatial dependency that involves the interrelationships of travel demand across different areas. Tobler’s first law of geography posits that areas in close proximity generally exhibit stronger relationships (Goodchild, 2004; Tobler, 1970). Demand for shared bikes tends to demonstrate stronger associations between geographically adjacent areas due to similar regional characteristics. Meanwhile, urban systems operate within network spaces defined by interconnected transportation infrastructures such as roads and transit lines (Batty, 2013). These networks could affect perceived distances and interactions between non-adjacent areas (Harvey, 1992). For example, areas connected by efficient transit hubs may experience notable demand interactions as bike sharing often complements public transport for first- and last-mile trips. Therefore, in bike sharing systems, the spatial dependency of travel demand manifests through not only geographical proximity but also network connectivity.
To date, limited efforts have been made to model spatial dependency in both continuous and network spaces for predicting bike sharing demand. Recent advancements in deep learning have enhanced spatiotemporal modeling through architectures such as convolutional neural networks (CNNs) and graph convolutional networks (GCNs) (Chai et al., 2018; Lin et al., 2018; Yao and Feng, 2024). CNNs are commonly used to capture local spatial dependency, while GCNs are employed to model demand interactions across bike stations (Jiang, 2022; Lin et al., 2018). Despite these innovations, existing approaches primarily focus on modeling the spatial dependency of travel demand either in continuous space or among bike sharing stations. These methods often neglect the topological dependencies introduced by urban transportation networks. Urban transportation networks play a critical role in shaping human travels (Batty, 2013; Christaller, 1966). These networks, including metro systems and cycling routes, can influence bicycle usage due to their functional connections with bike sharing systems (Di et al., 2025; Fosgerau et al., 2023; Gao et al., 2024; Kong et al., 2020; Yang et al., 2019; Zhu et al., 2024). While some models learn spatial relationships implicitly from demand data (Li et al., 2023; Xiang et al., 2025), they do not explicitly encode the physical structure of the transit systems that has been shown to correlate with bike sharing usage (Yang et al., 2019). Therefore, it is important to consider the hidden relationships of bike sharing demand within these networks and design an integrated solution to model their spatial dependencies in urban spaces.
In this study, we propose GeoTopo-Net, a novel deep learning framework that predicts bike sharing demand by modeling spatial dependencies in a coupled continuous and network space. Different from existing approaches, GeoTopo-Net integrates CNNs with GCNs to capture how demand patterns propagate across urban areas as well as transportation networks (e.g., metro and cycling networks). This new approach is inspired by the notable heterogeneity of bike sharing usage across urban spaces and their interrelated temporal patterns along the transportation networks. For the building block of GeoTopo-Net, we design two variants (sequential vs. parallel structure) to model spatial dependencies and evaluate how different strategies affect the prediction accuracies. The sequential structure, which considers bike sharing demand as a potential component of multimodal trips, models the local characteristics of travel demand before propagating it through the transportation networks. The parallel structure, instead, models the demand patterns independently in two spatial domains (continuous & network spaces) to preserve their distinctive characteristics.
This research makes two primary contributions. First, we propose a unified framework for modeling bike sharing demand that simultaneously considers dependencies in both continuous and network spaces. Second, we systematically evaluate various strategies for effectively integrating these two distinct types of spatial information. By evaluating GeoTopo-Net with benchmark solutions in five global cities, our study suggests that this new modeling strategy can improve short-term bike sharing demand forecast, particularly in areas with high demand and around public transportation networks. This study advances bike sharing travel demand prediction by coupling features from both continuous and network spaces. It serves as an inspiration for enhancing short-term forecasts of other demands such as ride-hailing and electric vehicle charging, which involve complex interdependencies in urban spaces.
The remainder of this article is organized as follows. Section 2 reviews the existing literature. Section 3 provides the details of study areas and datasets. Section 4 introduces our proposed methodology. Section 5 summarizes the experimental results. Finally, Section 6 discusses the implications of the findings and concludes the study.
2. Literature review
2.1. Predicting bike sharing demand: Models and solutions
A substantial body of research has focused on predicting travel demand for bike sharing systems (Li et al., 2023; Yang et al., 2020; Zhao et al., 2022). Early attempts approach this as a typical time series forecasting problem and employ traditional statistical models to capture temporal patterns at individual stations or within defined regions (Chen et al., 2024; Kaltenbrunner et al., 2010). Subsequent studies incorporate machine learning models (e.g., Random Forest) to account for external factors such as weather conditions (Feng et al., 2018; Hulot et al., 2018). Despite these advances, traditional models often do not incorporate spatial dependency that involves the interrelationships of travel demand across different areas.
Recent research has shifted toward deep learning models, leveraging their capacity for complex feature representation. CNNs, recurrent neural networks (RNNs), attention mechanisms and GCNs have emerged as prominent approaches (Chai et al., 2018; Gammelli et al., 2022; Li et al., 2022; Xu et al., 2018; Yan et al., 2024; Yao and Feng, 2024). These models are typically combined to address both spatial and temporal dimensions of bike sharing demand (Chai et al., 2018; Lin et al., 2018; Yao and Feng, 2024). For instance, Chai et al. (2018) represent bike stations as a graph structure and employ GCN with Long Short-Term Memory (LSTM) to predict demand flows. Yao and Feng (2024) develop graph attention structures to capture spatial dependency between stations and utilize multi-scale CNNs to address temporal variations. The spatial dependency of bike sharing usage is commonly modeled by CNNs and GCNs (Liang et al., 2024a; Xu et al., 2024). CNNs are applied when urban demand data are aggregated into grid cells (Jiang, 2022; Li et al., 2023), while GCNs are used when bike sharing usage is measured at unstructured units such as individual stations and clusters (Chai et al., 2018; Lin et al., 2018). Grid-based aggregation is widely used due to its adaptability to both station-based and dockless systems. It can be applied across different cities regardless of the specific station locations and can adapt well to system changes such as addition or removal of stations over time (Liang et al., 2024b). More recently, Transformer-based architectures have been adopted to summarize spatiotemporal features using self-attention mechanisms (Liu et al., 2023; Xu et al., 2023a,b). These attention operations adaptively weight feature importance and are utilized to model spatial, temporal, as well as both local and global demand patterns (Feng et al., 2024; Qian et al., 2025; Xiang et al., 2025). For instance, Xu et al. (2023a) employ a Transformer-based encoder within the neural processes framework to capture representations of known feature-demand pairs. Other studies have applied self-attention specifically to model temporal dependencies (Xiang et al., 2025), or to augment the spatial representations generated by CNNs (Qian et al., 2025).
Beyond spatial proximity, researchers have identified several influential factors on bike sharing demand, including weather conditions, land use patterns, and transportation infrastructure (Faghih-Imani and Eluru, 2016; Guzel et al., 2025; Jin and Sui, 2024; Liu et al., 2024; Yang et al., 2020; Zhu et al., 2024). These factors have been incorporated into prediction models through various regional features related to usage patterns, meteorological conditions, functional diversity, demographic characteristics, and infrastructure density (Chai et al., 2018; Feng and Liu, 2024; Liang et al., 2024a; Lin et al., 2018). Yang et al. (2020) find that network-derived features are more important than meteorological conditions in demand prediction. Recognizing the critical role of bike sharing systems as feeders to public transit, several studies have integrated public transit data into demand prediction models (Cho et al., 2021; Hua et al., 2024; Liang et al., 2024a; Lv et al., 2021; Zhang et al., 2018). For instance, Lv et al. (2021) categorize subway stations by flow patterns and incorporate these classes to predict the number of bike returns at nearby stations. Liang et al. (2024a) employ an adversarial network and incorporate subway, ride-hailing and bike sharing data to extract cross-mode knowledge for bike demand prediction. While these studies emphasize the interplay between bike sharing systems and urban transportation networks, research incorporating urban transportation network connectivity into bike sharing demand prediction remains limited.
2.2. The need to predict bike sharing demand in a coupled continuous and network space
Bike sharing demand arises from individual trips seeking access to essential amenities and services for daily activities (Cervero and Kockelman, 1997). These trips address accessibility gaps by connecting travelers to areas with desired resources. According to Tobler’s first law of geography (Goodchild, 2004; Tobler, 1970), nearby areas typically exhibit stronger relationships. Demand for shared bikes tends to demonstrate stronger associations between geographically adjacent areas due to similar local characteristics. The spatial dependency and time-dependent patterns of demand render it predictable (Feng and Liu, 2024).
The integration of bike sharing with urban transportation networks expands this spatial dependency into network space. Cities function as complex systems with hierarchical structures and interrelated networks (Batty, 2013). Transportation networks facilitate efficient movement between key urban destinations such as residences, workplaces, and service locations. These networks could affect perceived distances and interactions between non-adjacent areas through time–space compression effects (Harvey, 1992; Knowles, 2006). For example, areas connected by efficient transit hubs may experience notable demand interactions despite physical separation. As bike sharing often serves as a connector to public transit, network connectivity substantially influences demand patterns (Beecham et al., 2014; Yang et al., 2019). Metro systems and cycling networks can influence bicycle usage due to their functional connections with bike sharing systems (Di et al., 2025; Fosgerau et al., 2023; Gao et al., 2024; Kong et al., 2020; Yang et al., 2019; Zhu et al., 2024). Shared bikes offer a flexible solution for short-distance travel, which complements public transit and accommodates a variety of purposes such as commuting and leisure activities. Thus, it is important to consider the hidden relationships of bike sharing demand within these networks and design an integrated solution to model their spatial dependencies in urban spaces.
3. Study area and dataset
This study selects Chicago, New York City, Washington DC, London, and Singapore as study areas to evaluate the proposed model (Fig. 1). These five cities offer a diverse urban context for comprehensive assessment of our model. We collect bike sharing datasets from four station-based systems in Chicago, New York City, Washington DC, and London, and a dockless system in Singapore (Table 1). Each dataset documents five months of bicycle trip records T ∈ 𝒯, including pick-up and drop-off locations and timestamps for individual trips. These datasets are preprocessed to filter out invalid movements and mitigate GPS drifting oscillations (Xu et al., 2019). Additionally, urban transportation network data including metro networks and cycling routes are collected from official sources for each city. To maintain consistency, these datasets span the same years as the corresponding bike sharing datasets.
| City | Spatial resolution | Temporal resolution | Year | Training period | Validation period | Testing period |
|---|---|---|---|---|---|---|
| Chicago | 1 km | 1 h | 2023 | 01/06–30/09 | 01/10–05/10 | 06/10–31/10 |
| New York City | 1 km | 1 h | 2023 | 01/04–31/07 | 01/08–05/08 | 06/08–31/08 |
| Washington DC | 1 km | 1 h | 2023 | 01/06–30/09 | 01/10–05/10 | 06/10–31/10 |
| London | 1 km | 1 h | 2023 | 01/06–30/09 | 01/10–05/10 | 06/10–31/10 |
| Singapore | 1 km | 1 h | 2017 | 02/06–30/09 | 01/10–05/10 | 06/10–30/10 |
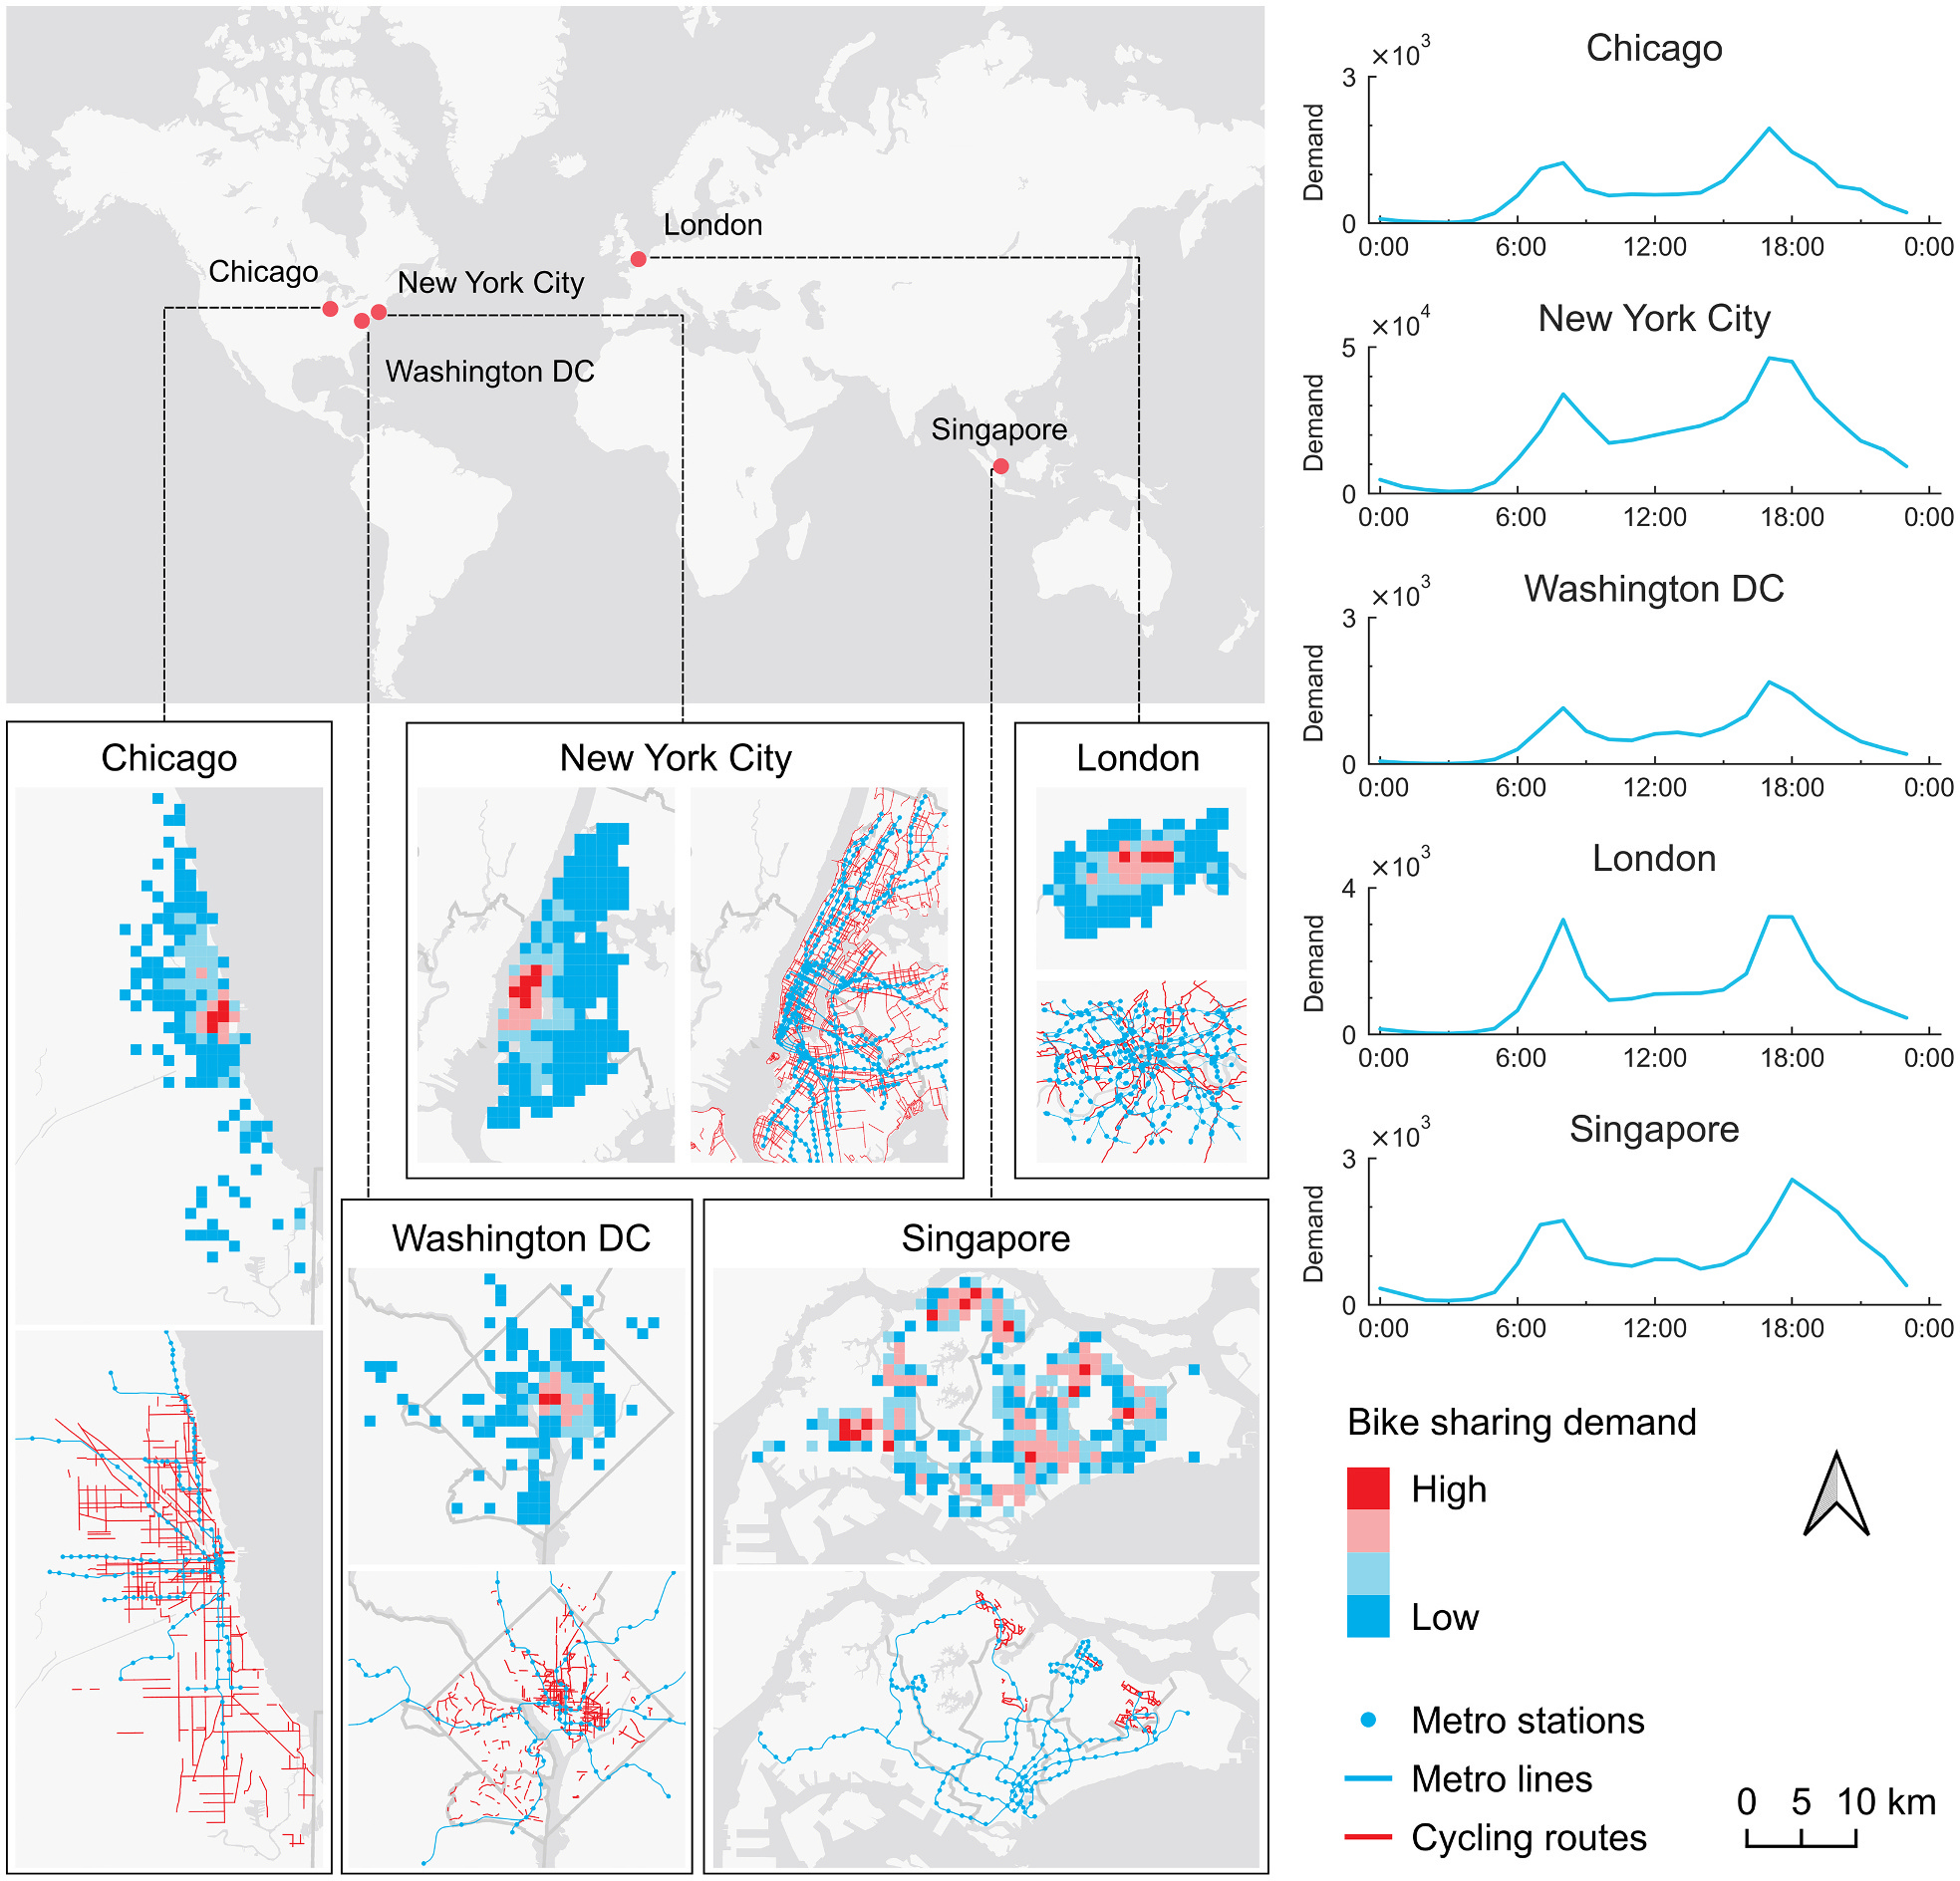
To unify the representation of demand data across both station-based and dockless systems, we employ a grid-based structure to partition the urban area into 1 km × 1 km regular cells, as illustrated in Fig. 1. The hourly travel demand is quantified by the total departures of bike sharing trips within each grid cell, defined as:
where xut represents the hourly demand in grid cell u at time slot t. 𝒯t is the set of bicycle trips that start or end in time slot t. T(O) and T(D) denote the departure and arrival locations of trips T, respectively. The symbol ∧ denotes the logical “and” operation, and card(⋅) represents the cardinality of a set. The condition T(O) ∈ u ∧ T(D) ∉ u identifies trips that originate in grid cell u but terminate elsewhere. We exclude trips that both begin and end within the same cell, as these do not affect the overall balance of bike supply and demand in that area. For a city divided into r × c grid, the hourly demand for shared bikes is formulated as matrix Xt:
where Xt ∈ ℝr×c represents the bike sharing demand at the city scale in time slot t. This study focuses on predicting the short-term travel demand Xt for the next hourly period based on historical observations Xt−1 = {Xk | k = 1, 2, ⋯, t−1}.
4. Methodology
4.1. Overall structure of GeoTopo-Net
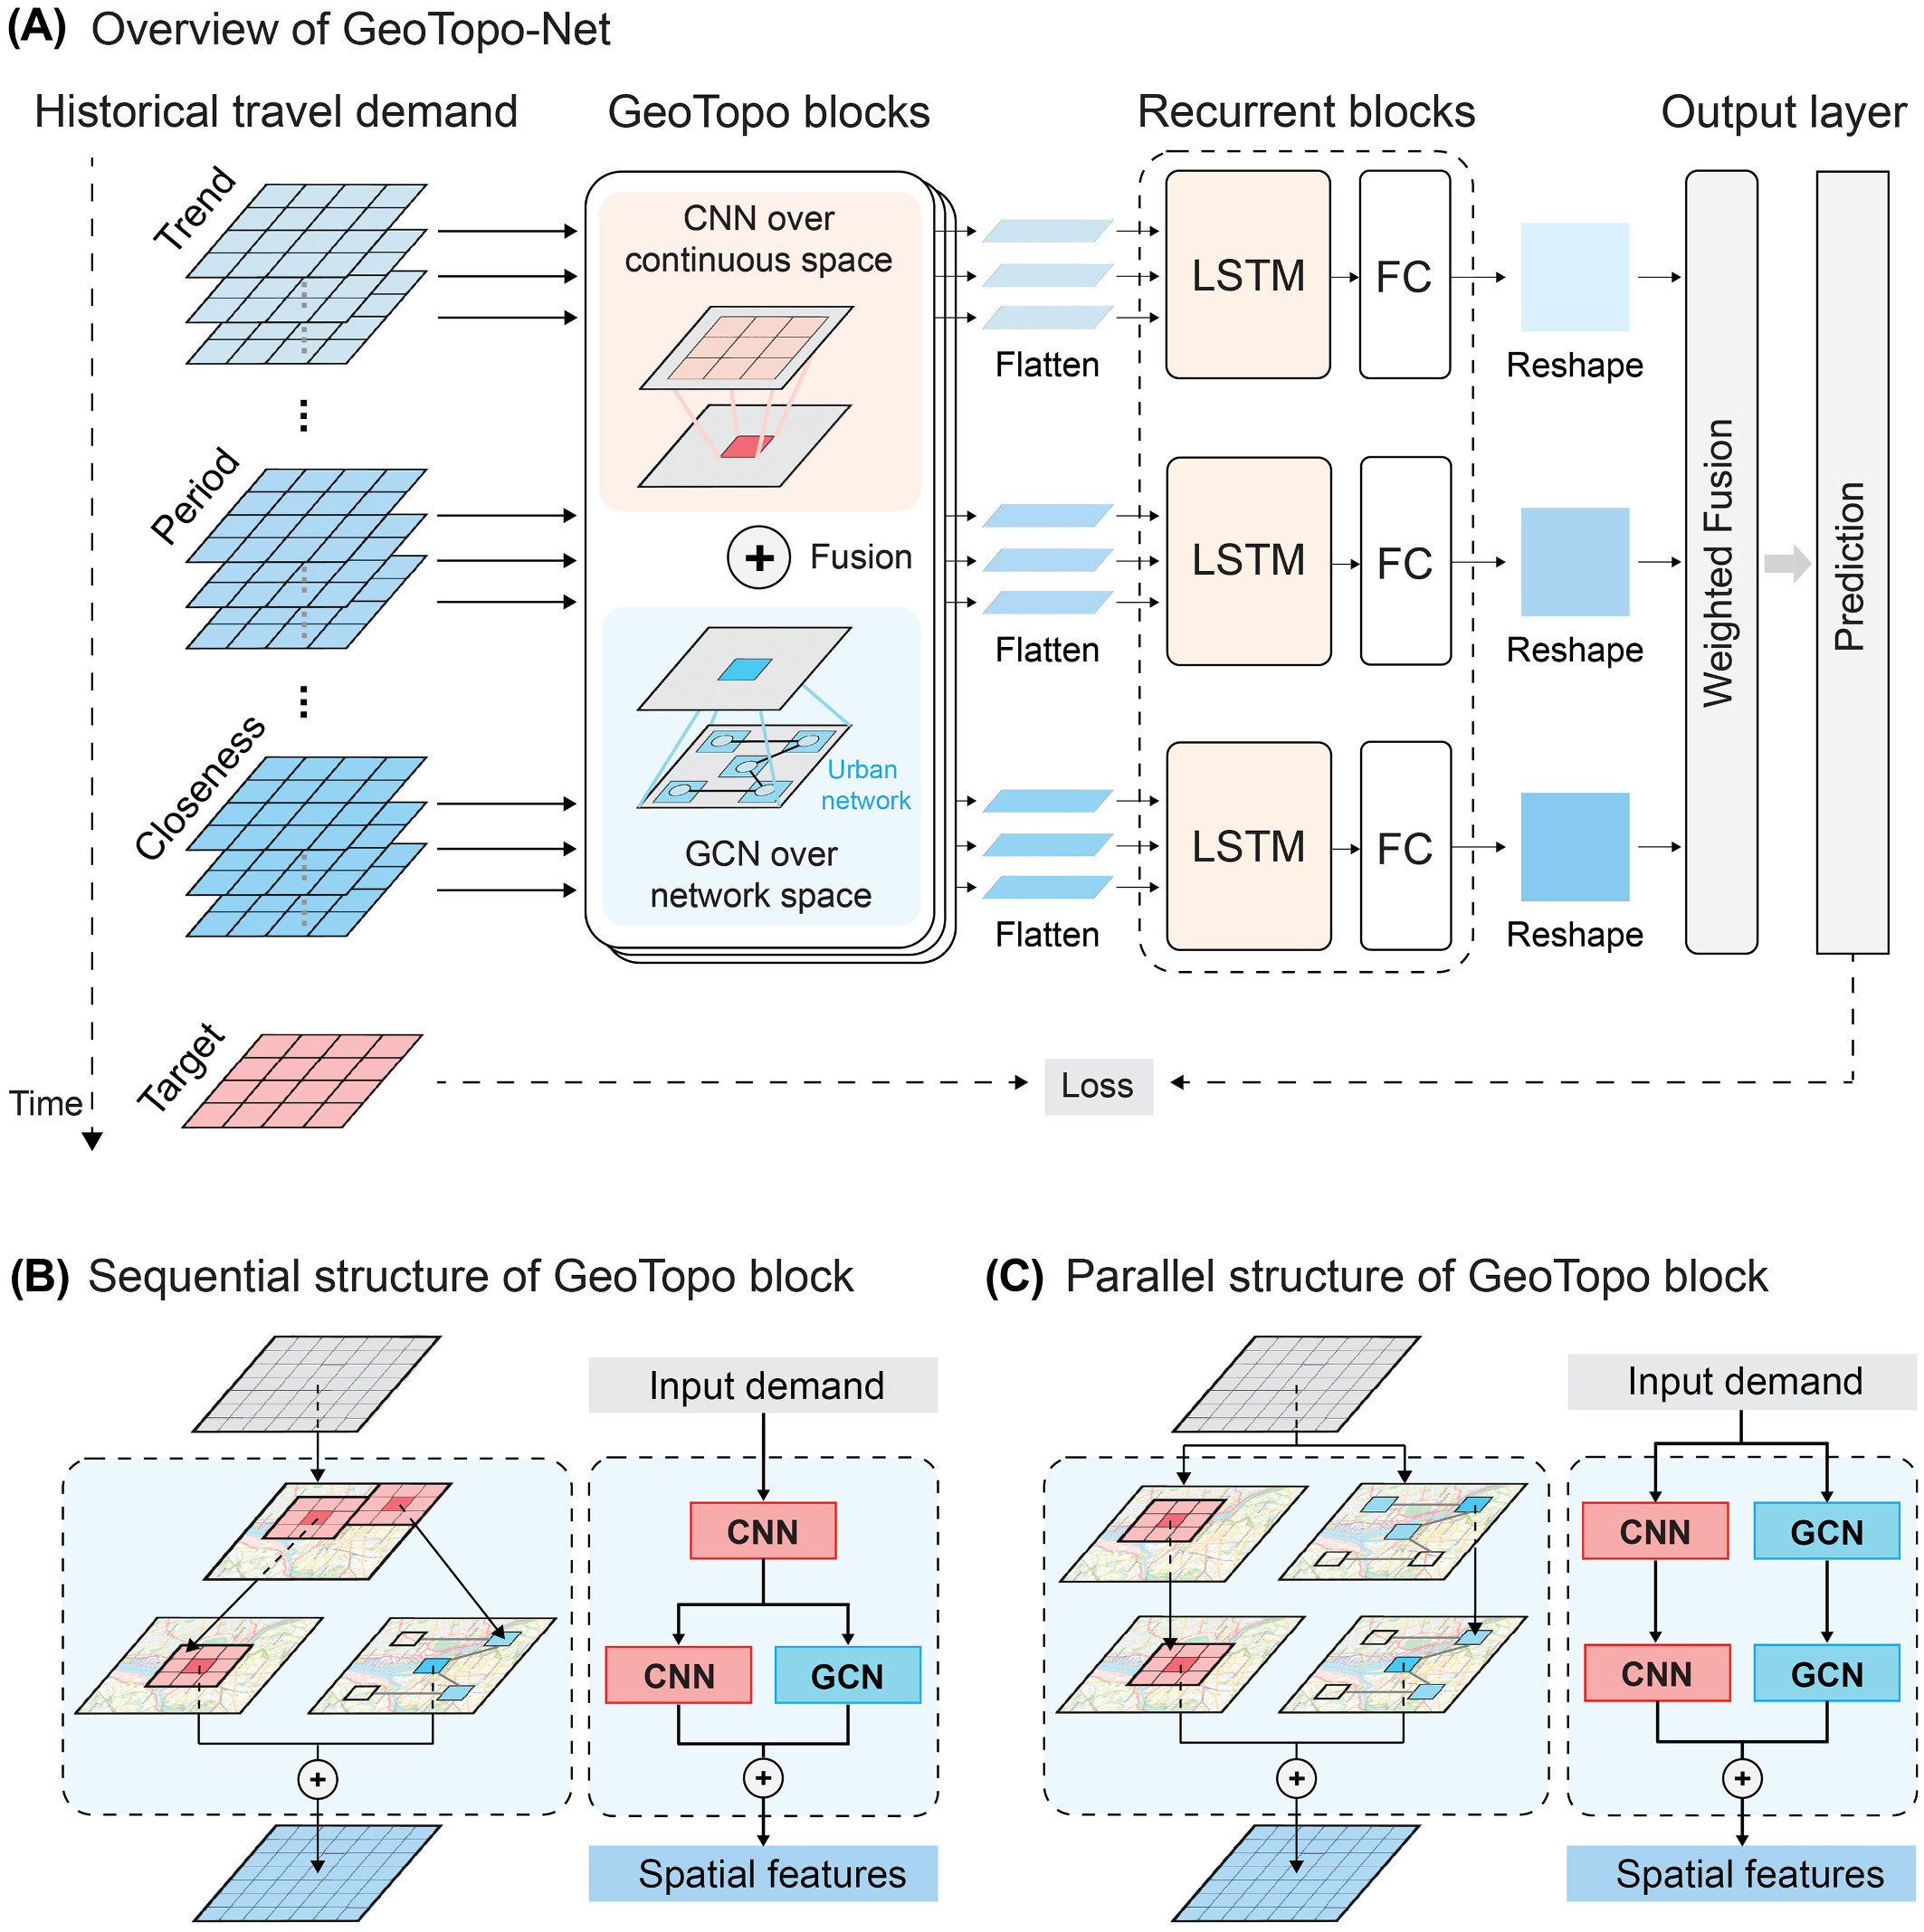
Fig. 2 illustrates the overall structure of GeoTopo-Net. The model consists of GeoTopo blocks, recurrent blocks, an input layer and an output layer. The input layer is used to process two primary features, specifically historical travel demand and the topologies of urban transportation networks. Drawing on established studies (Li et al., 2023; Zhang et al., 2017), our model considers key periods with different temporal proximity to the target period rather than utilizing the entire set of historical observations. These periods are categorized as Closeness, Period, and Trend. This approach has been shown to reduce computational complexity and mitigate the negative effect of redundant information (Li et al., 2024a). Building on this foundation, GeoTopo-Net integrates spatial dependencies from both continuous space (via CNNs) and physical transportation network topology (via GCNs).
As shown in Fig. 2A, the historical travel demand and urban transportation network topology are fed into the GeoTopo blocks, which serve as the core components for capturing spatial dependency. GeoTopo block utilizes CNNs to capture the spatial dependency of bike sharing demand in continuous space. GCNs are incorporated in GeoTopo block to integrate the topological dependency introduced by urban transportation networks. The features learned in continuous and network spaces are subsequently fused and flattened to represent spatial dependency of bike sharing demand at a specific time slot. Then, the resulting sequences of spatial features are passed through recurrent blocks. The recurrent block uses an LSTM to model the temporal dependency of demand. Finally, the spatiotemporal features learned from the three key periods are fused using a weighted fusion technique. The output of feature fusion layer is the predicted values of bike sharing demand for the target time slot.
4.2. Capturing spatial dependency in a coupled continuous and network space
4.2.1. Structures of GeoTopo block
We design two variants (sequential vs. parallel structure) for the GeoTopo block to model spatial dependencies. These structures differ primarily in how they incorporate features of topological dependency. In the sequential structure (Fig. 2B), information from areas surrounding the target cell is first aggregated by a CNN to form a contextual summary. This summary then feeds into a GCN that models how the information propagates through the transportation network. In contrast, the parallel structure (Fig. 2C) models spatial dependencies independently in both continuous and network spaces through separate processing pathways.
Our design is motivated by two considerations. The sequential structure reflects the interconnecting role of bike sharing within transportation networks. By linking CNN and GCN sequentially, the structure considers bike sharing as a potential component of multimodal trips where users often use shared bicycles for short-distance travel to transit hubs before continuing their journey via metro networks. This arrangement helps identify underlying interactions between continuous and network spaces.
The parallel structure, meanwhile, directly models distinct bike sharing usage patterns in two spatial domains. By deploying CNN and GCN in parallel, the model assumes that while both types of spatial dependencies are important, their underlying mechanisms may differ significantly. This approach preserves the unique characteristics of each spatial dependency. Both structures ultimately merge features from continuous and network spaces to form a comprehensive spatial representation. This process is expressed as:
where Fusion(⋅) denotes the operation used to integrate the spatial features in continuous space hgeo and the topological features htopo. When incorporating multiple transportation networks, each network is processed through a dedicated branch to represent its unique connectedness. ∑i indicates the summation of features across the individual branches i. The final output hs integrates features captured from all branches to create a complete spatial dependency representation.
4.2.2. CNN over continuous space
Spatial dependency in continuous space can be effectively modeled through CNNs, which capture local spatial patterns through learnable kernels (Ai, 2022). In this approach, convolutional operations are applied to aggregate information for the target areas from their surrounding neighborhoods. This mechanism effectively represents how spatial interactions diminish with distance, a fundamental principle in geography. To model this dependency in bike sharing demand, we use CNNs to identify patterns between the target areas and their physically adjacent areas. This process applies 2D convolutions over grid-based features, using multiple kernels to incorporate neighborhood information from different perspectives. For an input map with Fin features (X ∈ ℝFin×r×c), the extracted features in continuous space are computed as:
where hgeo ∈ ℝFout×r×c denotes the resulting features in continuous space. Fout represents the number of output features. The symbol ⋆ indicates the 2D cross-correlation operator, which serves as a computational implementation of the convolution process. Wgeo ∈ ℝFout×Fin×ksize×ksize are the learnable convolution kernels with size determined by ksize. bgeo ∈ ℝFout is the learnable bias term, and σ (⋅) denotes the activation function that introduces non-linearity to CNN.
4.2.3. GCN over network space
To capture spatial dependencies within the urban transportation network, we utilize GCNs to represent demand patterns based on the topological connectivity of urban areas. This approach represents the connectivity of urban transportation networks using an adjacency matrix and models spatial features according to their topological relationships. Specifically, the adjacency matrix A ∈ ℝM×M encodes whether pairs of urban grid cells are directly connected via transportation networks. The matrix is constructed based on binary connectivity, where an entry is assigned a value of one if two grid cells are directly linked by a transportation network, and zero otherwise. For a given transportation network, the entries of the adjacency matrix Aij are defined as follows:
where vi and vj represent urban grid cells within the set V = {v1, v2, ⋯, vM}. E ⊆ V × V denotes the set of edges that correspond to direct topological connections established by the transportation network. For metro networks, a direct connection (vi, vj) ∈ E occurs when both grid cells contain consecutive metro stations on the same metro line. In the context of cycling routes, a direct connection (vi, vj) ∈ E exists if a designated cycling route directly links the two grid cells. In this study, transportation networks are represented as static topologies that reflect the physical infrastructure during a stable period. While metro connectivity may experience temporal variations, its accessibility is assumed to be continuously available at the hourly scale. This network structure can be further described using the Laplacian matrix, defined as L = D − A, where D is the degree matrix with diagonal elements Dii = ∑jAij that quantify the connection strength of each cell.
The Chebyshev spectral graph convolutional operator (ChebConv) (Defferrard et al., 2016) is then adopted to model spatial dependencies of demand within the urban transportation networks. This operator captures the dependencies between the target areas and their topological neighbors based on the formula:
where htopo ∈ ℝ|V|×Fout denotes the extracted topological features from the GCN layer. Xtopo ∈ ℝ|V|×Fin represents input demand features of each grid cell. The normalized Laplacian matrix L̃ is computed as 2(I − D−1/2AD−1/2)/λmax − I. The parameters W ∈ ℝ(K+1)×Fin×Fout are learnable weights, while btopo ∈ ℝFout is the learnable bias term. The Chebyshev polynomials Tk(x) follow the recursive definition Tk(x) = 2 xTk−1(x) − Tk−2(x), with initial conditions T0(x) = 1 and T1(x) = x. The Chebyshev-based operator is chosen for its competitive performance (see Table B.1) and its capacity to model topological dependencies in demand across connection distances of up to K hops (Defferrard et al., 2016). This capability stems from the fact that the nonzero terms in TK(L̃) ≈ f(LK) correspond to paths of length K that connect locations within the transportation network. Additional technical details regarding the spectral convolution are provided in Appendix A.
4.3. Modeling temporal dependency and fusing spatiotemporal features
Although the GeoTopo block is primarily designed to capture the spatial dependencies of bike sharing demand, accurately forecasting this demand also requires an understanding of its temporal patterns. To model these temporal dependencies, this study employs recurrent blocks that consist of an LSTM network followed by a linear layer. The process for extracting spatiotemporal features is formulated as:
where LSTM(⋅) represents the LSTM network operation. Wtim denotes the learnable weight matrix, and btim is the learnable bias parameter. To enhance prediction efficiency while avoiding redundancy in long observations, the model focuses on three key periods that capture distinct temporal patterns in bike sharing demand, namely Closeness, Period, and Trend. Closeness represents the recent demand patterns from the immediate past, Period denotes daily recurring patterns at the same hour, and Trend encompasses weekly patterns reflecting longer-term directional changes. These key periods are mathematically defined as:
where lc, lp, and lt represent the sequence lengths for each key period. In this study, we set lc to 24 (previous 24 h), lp to 7 (same hour for the past 7 days), and lt to 2 (same hour for the previous 2 weeks). Each key period is processed through the GeoTopo blocks and recurrent blocks to extract spatiotemporal features. These features are then integrated through element-wise weighted addition to generate the final demand prediction X̂t for time slot t:
where Wc, Wp and Wt ∈ ℝr×c are learnable weights that determine the contribution of each key period to the final prediction. The resulting demand prediction X̂t is compared with the actual bike sharing demand Xt during the loss calculation and backpropagation process.
4.4. Training and evaluating GeoTopo-Net
The bike sharing demand prediction is formulated as a regression task that aims to minimize the difference between actual and predicted values. We employ mean-squared error (MSE) as the loss function to guide model training (Eq. (12)). To focus computational resources on relevant areas, we implement a masked loss strategy that excludes undeveloped sites in station-based systems. The Adam optimization algorithm is used to update model parameters during training. The performance of GeoTopo-Net is evaluated using three metrics, including root mean-squared error (RMSE), mean absolute error (MAE), and mean absolute percentage error (MAPE). Lower values of these metrics indicate better model performance. The formulas for these metrics are presented in Eqs. (13)–(15).
where ŷi is the predicted demand and yi is the actual demand.
The performance of GeoTopo-Net is evaluated in both sequential and parallel structures against a diverse set of baseline models. These baselines include the traditional time series method ARIMA (Kaltenbrunner et al., 2010) and recurrent neural networks such as LSTM (Xu et al., 2018) and GRU (Chen et al., 2020). The evaluation also incorporates a range of spatiotemporal deep learning models, from established convolutional models such as ConvLSTM (Shi et al., 2015) and ST-ResNet (Zhang et al., 2017) to ResLSTM (Zhang et al., 2021a), a network-based model originally developed for rail passenger flow prediction. To highlight the impact of integrating urban network topology, our comparison includes CNN + LSTM, a model without topological inputs, and IrConvLSTM (Li et al., 2023), which captures spatial relationships through data-driven irregular convolutions. To enhance the robustness of our evaluation, we compare against recent Transformer-based models, including ST-TSNet (Peng and Huang, 2022), which combines convolutions with Transformer architectures, as well as the fully Transformer-based STAEformer (Liu et al., 2023) and ProSTformer (Yan et al., 2024).
The dataset is partitioned into three subsets, including the first 4 months for training, the next 5 days for validation, and the remaining records for testing (Table 1). To ensure statistical robustness, each experiment is conducted ten times with varying initial states. For fair comparison, all hyperparameters across the models are standardized and the parameters of the baseline models are calibrated to achieve optimal performance. Specifically, a grid search is conducted for GeoTopo-Net using the predefined search space (Table B.2). Based on experimental results (see Tables B.3 and B.4), the dimensions of hidden and output feature in the GeoTopo block are set to 32 and 1, respectively. The receptive field of GCN is configured to encompass 2-hop neighbors. Following established practices in spatiotemporal forecasting research (Hong et al., 2023; Li et al., 2024a; Wang et al., 2021), we employ an adaptive learning strategy that is widely used to enhance convergence and mitigate overfitting. Instead of using cosine annealing, we adopt the reduce-on-plateau learning rate scheduler as it does not require a pre-defined decay cycle and can adaptively adjust the learning rate across cities with varying data scales and temporal dynamics. Training begins with an initial learning rate of 1 × 10⁻³ and runs for a maximum of 200 epochs. The learning rate is reduced by a factor of 0.1 when no improvement is observed over three consecutive epochs. Training concludes when either the maximum epoch limit is reached or the learning rate drops below 9 × 10⁻⁶. All models are implemented using PyTorch (Paszke et al., 2019), PyG (Fey and Lenssen, 2019), and LibCity (Wang et al., 2021) frameworks. Testing is conducted on a Linux system with an NVIDIA A40 GPU.
5. Analysis results
5.1. Overall performance of GeoTopo-Net
We evaluate the GeoTopo-Net that incorporates the topological dependencies in both metro and cycling networks (M + C) in each city. Table 2 shows that GeoTopo-Net demonstrates highly competitive and often superior performance across the five cities. When compared to the baseline model CNN + LSTM, GeoTopo-Net significantly reduces prediction errors by up to 8.9 % in RMSE, 6.8 % in MAE, and 5.9 % in MAPE. This demonstrates the effectiveness of GeoTopo-Net in capturing both continuous and network-based dependencies through its integrated structure. Moreover, the superiority of GeoTopo-Net over IrConvLSTM indicates that incorporating explicit physical networks as a structural prior is a highly effective strategy. The model also outperforms ResLSTM, a model specifically designed for network-based prediction. GeoTopo-Net achieves the lowest prediction errors in New York City, Washington DC, and Chicago, while the Transformer-based model STAEformer shows slightly better performance in Singapore. Furthermore, GeoTopo-Net exhibits a low standard deviation across its performance metrics (Table B.5).
| Model | Chicago | New York City | Washington DC | London | Singapore |
|---|---|---|---|---|---|
| ARIMA | 5.38/2.74/0.71 | 64.54/30.30/0.64 | 6.19/3.24/0.70 | 8.56/4.67/0.76 | 2.88/1.88/0.66 |
| LSTM | 4.06/2.34/0.67 | 43.33/21.73/0.65 | 4.14/2.41/0.61 | 5.17/3.14/0.59 | 2.65/1.76/0.68 |
| GRU | 4.25/2.43/0.69 | 47.41/24.41/0.80 | 4.27/2.47/0.62 | 5.14/3.18/0.61 | 2.66/1.78/0.68 |
| ConvLSTM | 5.32/2.95/0.86 | 52.54/25.09/0.70 | 4.99/2.70/0.62 | 5.82/3.56/0.70 | 2.73/1.77/0.65 |
| ST-ResNet | 4.05/2.51/0.75 | 41.52/23.13/0.69 | 4.19/2.61/0.70 | 5.03/3.25/0.61 | 2.67/1.81/0.65 |
| ResLSTM | 4.08/2.41/0.74 | 41.87/20.96/0.58 | 4.30/2.48/0.62 | 5.38/3.33/0.67 | 2.63/1.77/0.70 |
| ST-TSNet | 4.19/2.53/0.76 | 42.70/23.20/0.63 | 4.36/2.72/0.75 | 5.68/3.48/0.64 | 2.59/1.73/0.63 |
| CNN + LSTM | 4.14/2.36/0.68 | 39.65/19.88/0.53 | 3.96/2.33/0.59 | 4.94/3.04/0.55 | 2.58/1.69/0.62 |
| IrConvLSTM | 3.96/2.28/0.65 | 38.04/19.48/0.53 | 4.28/2.47/0.62 | 5.58/3.37/0.65 | 2.58/1.70/0.62 |
| ProSTformer | 4.07/2.35/0.66 | 44.56/23.01/0.70 | 5.01/2.78/0.67 | 5.45/3.35/0.63 | 2.57/1.67/0.59 |
| STAEformer | 3.96/2.29/0.70 | 40.60/22.25/0.70 | 4.11/2.40/0.70 | 4.67/2.99/0.58 | 2.46/1.61/0.58 |
| GeoTopo-Net Sequential | 3.78/2.20/0.64 | 36.69/19.13/0.53 | 3.80/2.27/0.58 | 4.70/2.91/0.52 | 2.58/1.69/0.61 |
| GeoTopo-Net Parallel | 3.77/2.20/0.64 | 37.06/19.26/0.53 | 3.84/2.28/0.58 | 4.75/2.94/0.53 | 2.55/1.67/0.61 |
Note: The best performance is highlighted in bold, and the second is marked with underline. Two variants of GeoTopo-Net incorporate both metro and cycling networks (M + C).
Both the sequential and parallel structures of GeoTopo-Net generally achieve better performance compared to baseline models. While their overall performance remains close across cities, the sequential structure demonstrates slightly better results in most cases. Specifically, the sequential structure of GeoTopo-Net achieves the highest accuracy in New York City, Washington DC and London, while the parallel structure performs marginally better in Chicago and Singapore. The integration of both the metro and cycling networks provides extensive information about the underlying spatial connections affecting bike sharing demand, which may explain the relatively minor performance gaps between the two variants. The differences in performance between the two variants might relate to variations in urban layouts and transportation patterns among the cities. Predictions in New York City feature substantially higher RMSE and MAE values for all models. This indicates that New York City might experience relatively higher demand for shared bicycles.
5.2. Performance improvement after integrating topological dependency in urban networks
To better understand the benefit of incorporating network-based dependency, we conduct an ablation experiment that compares the performance of models with and without urban transportation networks. To this end, we incrementally incorporate metro networks (M), cycling routes (C), and their combination (M + C) into GeoTopo-Net, and evaluate both its sequential and parallel structures. This approach results in six configurations for comparative analysis. The CNN + LSTM model is included as the baseline without urban network integration, given its backbone role in GeoTopo-Net and its robust performance demonstrated in Section 5.1.
| Model | Network | Chicago | New York City | Washington DC | London | Singapore |
|---|---|---|---|---|---|---|
| CNN + LSTM | — | 4.14/2.36/0.68 | 39.65/19.88/0.53 | 3.96/2.33/0.59 | 4.94/3.04/0.55 | 2.58/1.69/0.62 |
| GeoTopo-Net Sequential | Metro (M) | 3.75/2.19/0.64 | 39.49/19.87/0.53 | 3.96/2.33/0.58 | 4.66/2.89/0.52 | 2.55/1.67/0.61 |
| Cycling (C) | 3.76/2.19/0.64 | 39.41/19.88/0.53 | 3.82/2.27/0.58 | 4.69/2.90/0.52 | 2.58/1.69/0.61 | |
| M + C | 3.78/2.20/0.64 | 36.69/19.13/0.53 | 3.80/2.27/0.58 | 4.70/2.91/0.52 | 2.58/1.69/0.61 | |
| GeoTopo-Net Parallel | Metro (M) | 4.00/2.31/0.66 | 36.87/19.13/0.52 | 3.81/2.27/0.58 | 4.70/2.91/0.52 | 2.56/1.68/0.61 |
| Cycling (C) | 3.93/2.28/0.66 | 36.67/19.06/0.52 | 3.83/2.28/0.58 | 4.76/2.94/0.53 | 2.58/1.69/0.62 | |
| M + C | 3.77/2.20/0.64 | 37.06/19.26/0.53 | 3.84/2.28/0.58 | 4.75/2.94/0.53 | 2.55/1.67/0.61 |
Note: The best performance is highlighted in bold, and the second is marked with underline.
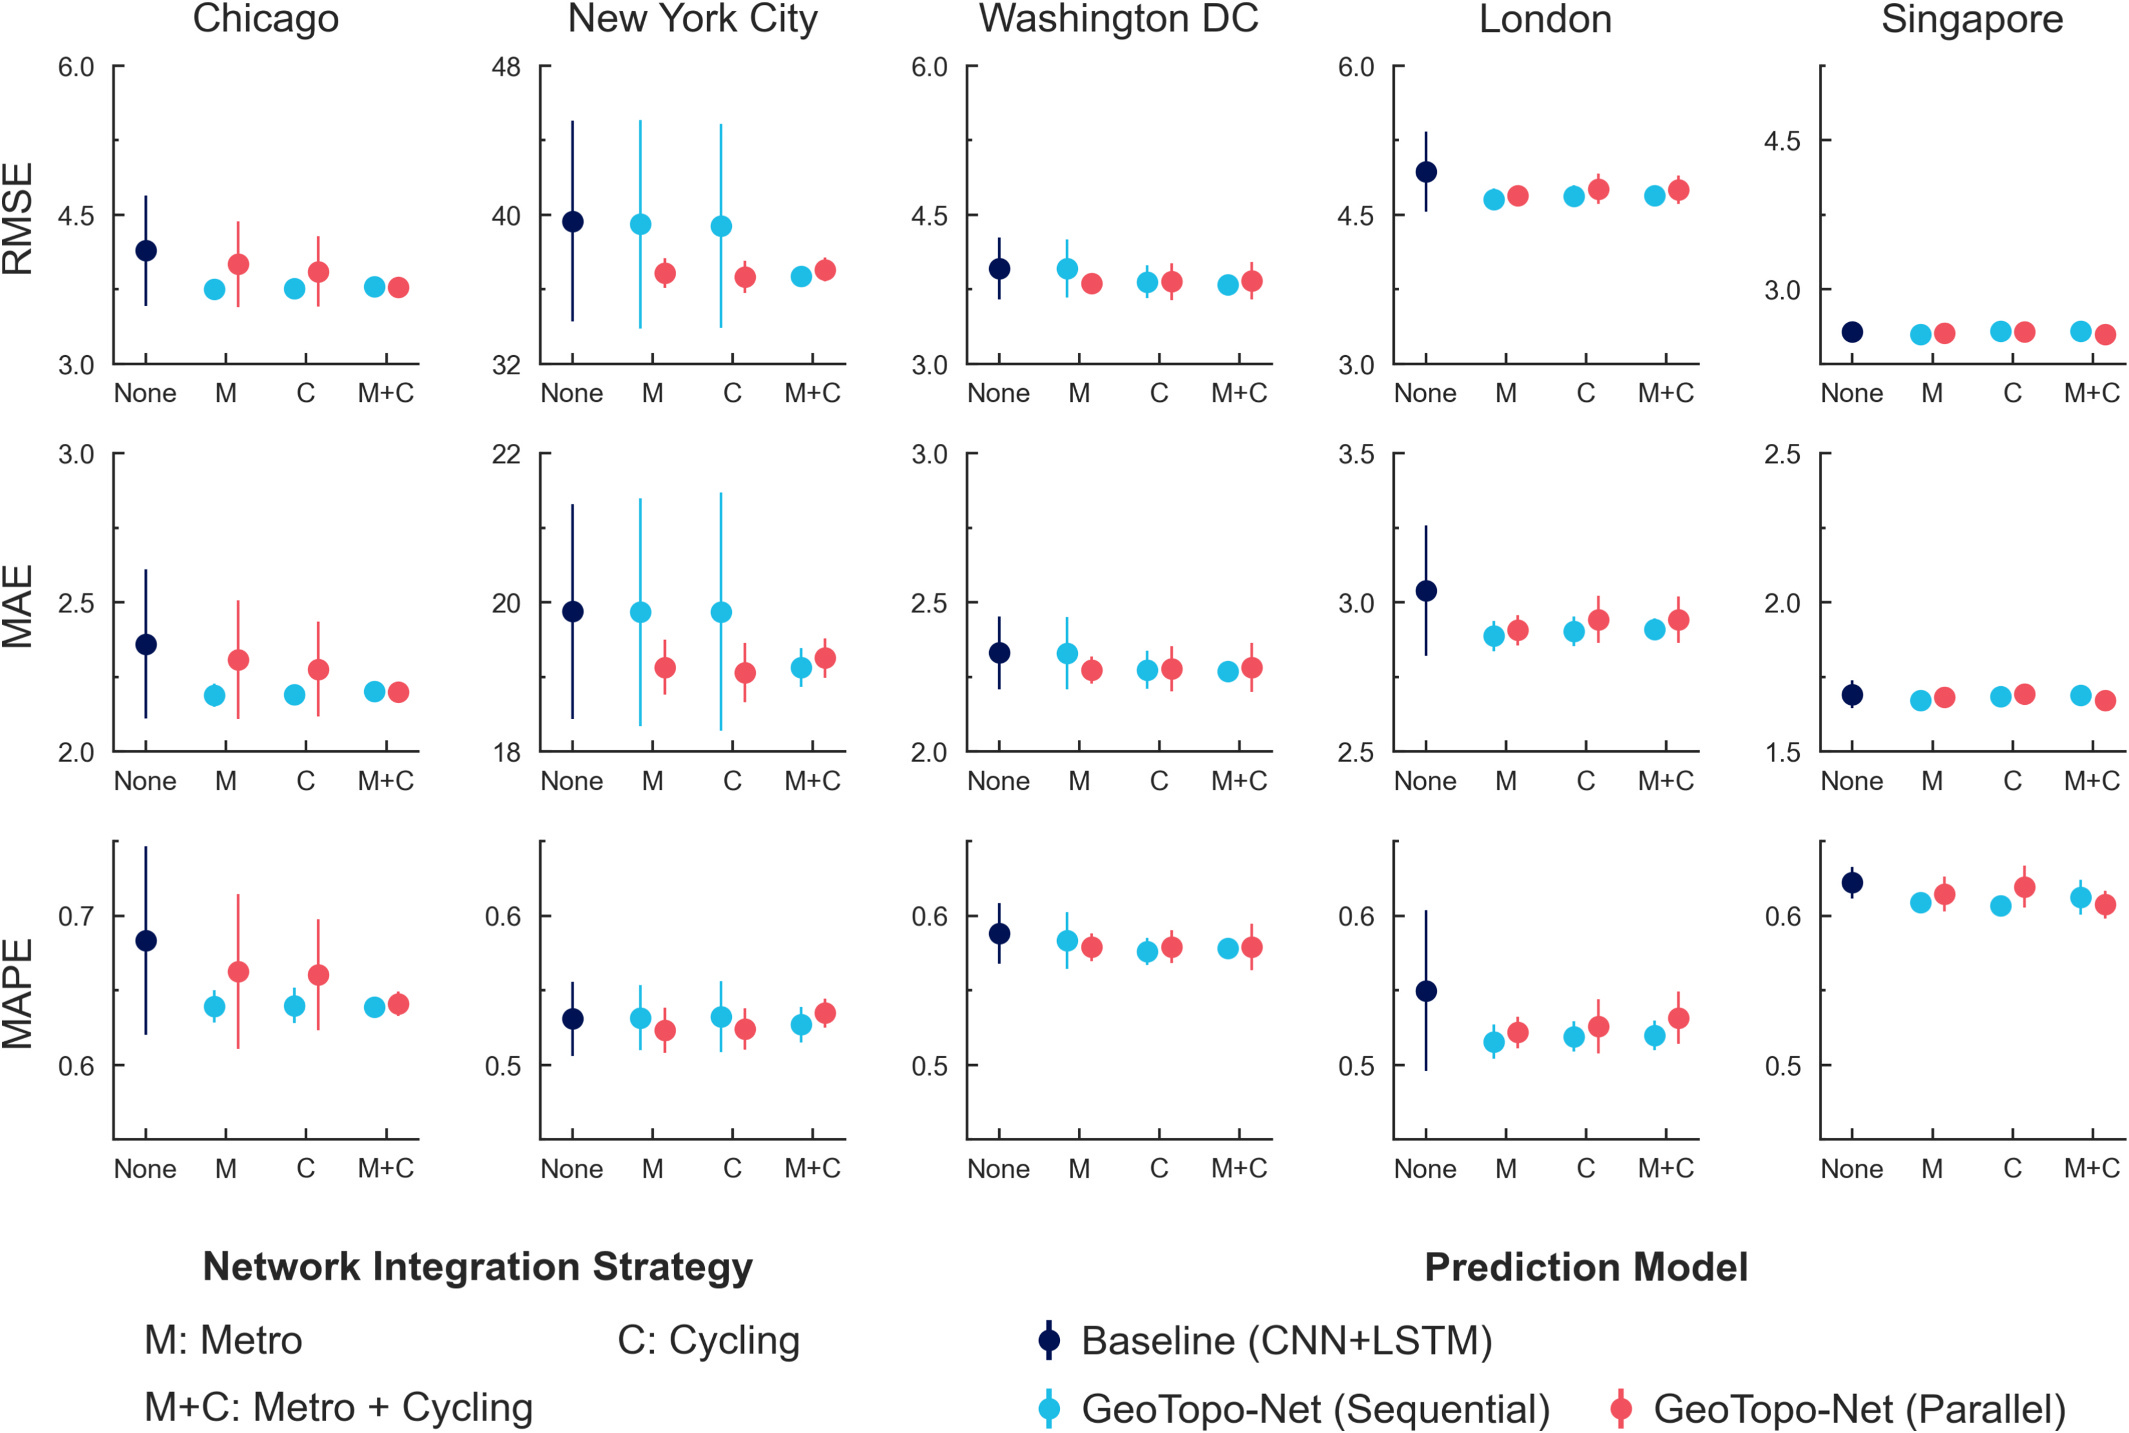
As shown in Table 3, integrating topological dependencies in transportation networks substantially improves prediction accuracy compared to the model that solely captures spatial features based on geographical proximity. Metro network integration generally yields more significant performance improvements across cities than integrating cycling network. The combination of both metro and cycling networks notably further enhances the robustness of GeoTopo-Net. Regarding the two model variants, the sequential structure of GeoTopo-Net generally outperforms its parallel counterpart. The sequential variants of GeoTopo-Net achieve the best performance in all cities except New York City. When examining city-specific patterns, we observe that metro-only models provide optimal results for Chicago, London, and Singapore, while New York City benefits most from cycling network integration. Washington DC shows the best performance when both metro and cycling networks are incorporated. Fig. 3 demonstrates the trend of decreasing prediction errors as additional urban network topology is integrated into the model. We also observe that transportation network integration reduces performance variability across multiple trial runs compared to the baseline model. An exception to these trends appears in the dockless bike sharing system of Singapore, where all model variations show minimal performance differences regardless of network integration.
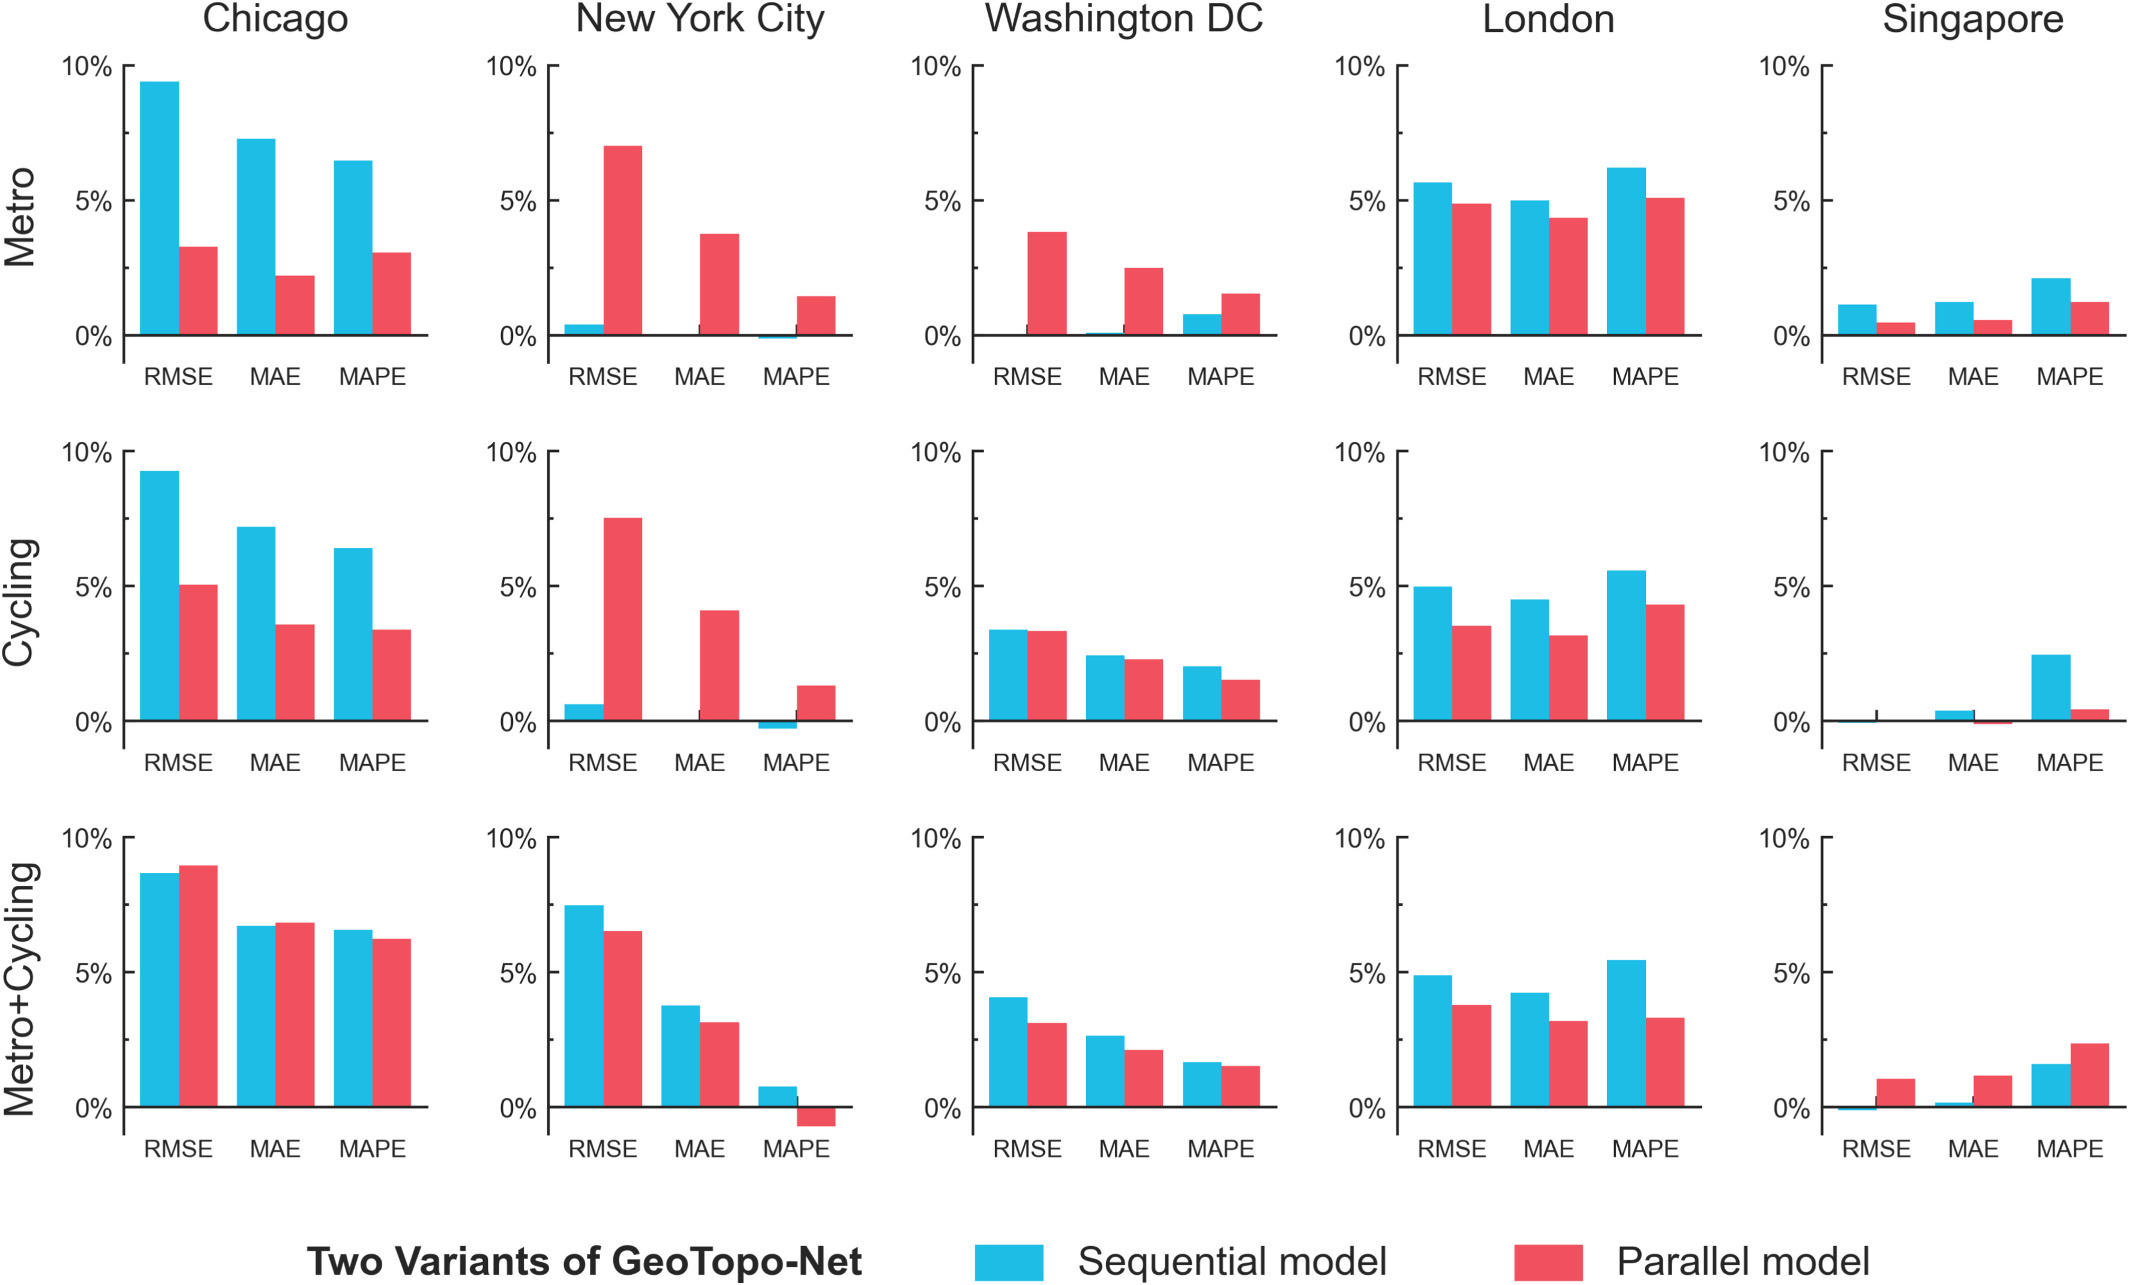
We further quantify the degree of these improvements in Fig. 4. Overall, integrating both metro and cycling route networks tends to yield superior predictive performance. The sequential structure achieves better results when incorporating multiple transportation networks, while the parallel structure exhibits stable performance across different urban network integrations. The most substantial improvements appear in Chicago and London, where the sequential integration of both transportation networks improves performance by over 5 %. In New York City, the parallel structure outperforms the sequential variant when integrating single transportation networks. Washington DC shows broad improvements across most configurations, with the exception of sequentially integrating metro networks. The performance on the dockless system of Singapore shows more modest improvements, with gains below 3 % across all configurations and minimal benefits from cycling network integration.
5.3. Spatial patterns of prediction improvements from metro network integration
The previous section demonstrates the performance improvements resulting from incorporating topological dependency within transportation networks, which naturally prompts the question: how are these improvements spatially distributed across urban environments?
To address this inquiry, this section utilizes the parallel structure of GeoTopo-Net with metro network integration as an illustrative example. As shown in Fig. 5, prediction accuracy improves across most urban areas in all five cities. The most substantial improvements are concentrated in central districts with high ridership volumes and areas near metro lines. In Chicago, these improvements radiate from high-demand centers such as the Chicago Loop, with the effect gradually diminishing toward peripheral areas. London exhibits widespread improvement throughout its urban core. This is potentially attributable to its dense and interconnected transit infrastructure (e.g., Tube and Rail networks). The spatial distribution of prediction errors (Fig. C.1) shows that absolute and relative prediction errors exhibit distinct spatial patterns. While central districts typically manifest high absolute errors due to demand volatility, these areas also experience the greatest benefits from metro network integration. GeoTopo-Net achieves moderate improvements in peripheral areas, even where relative errors remain high. Overall, these spatial patterns demonstrate that incorporating topological dependency in metro networks enhances predictive performance across most urban locations.
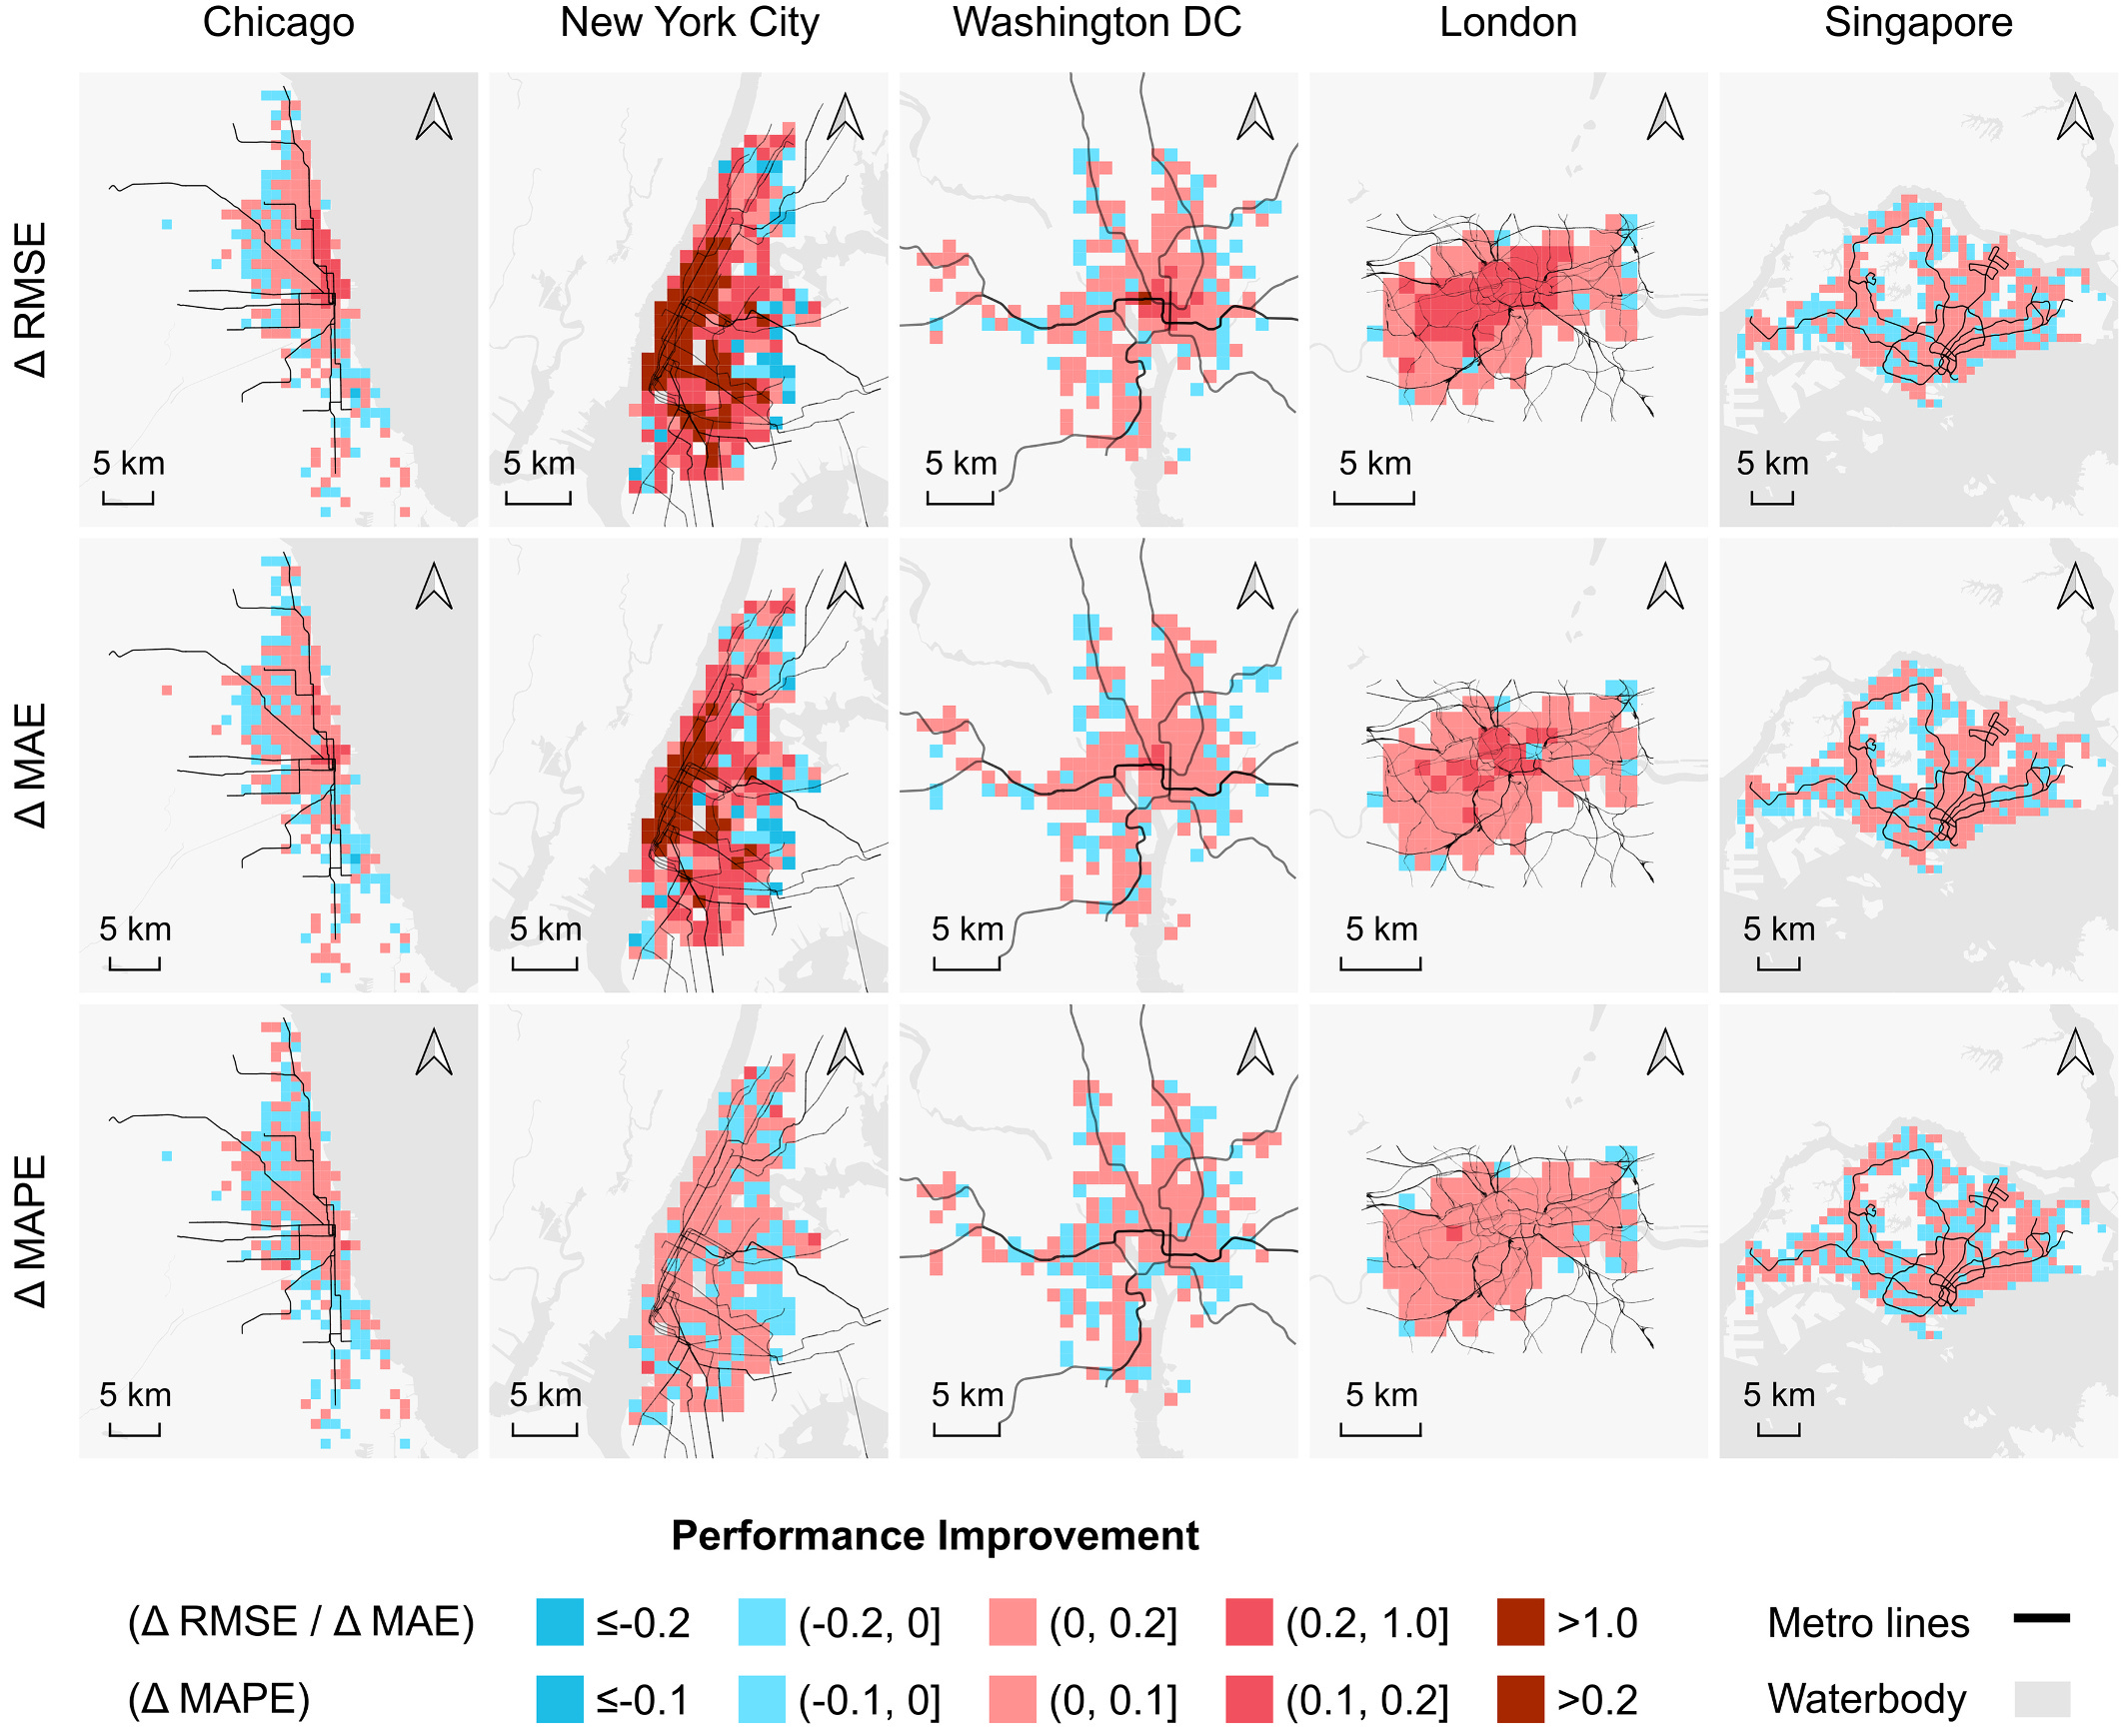
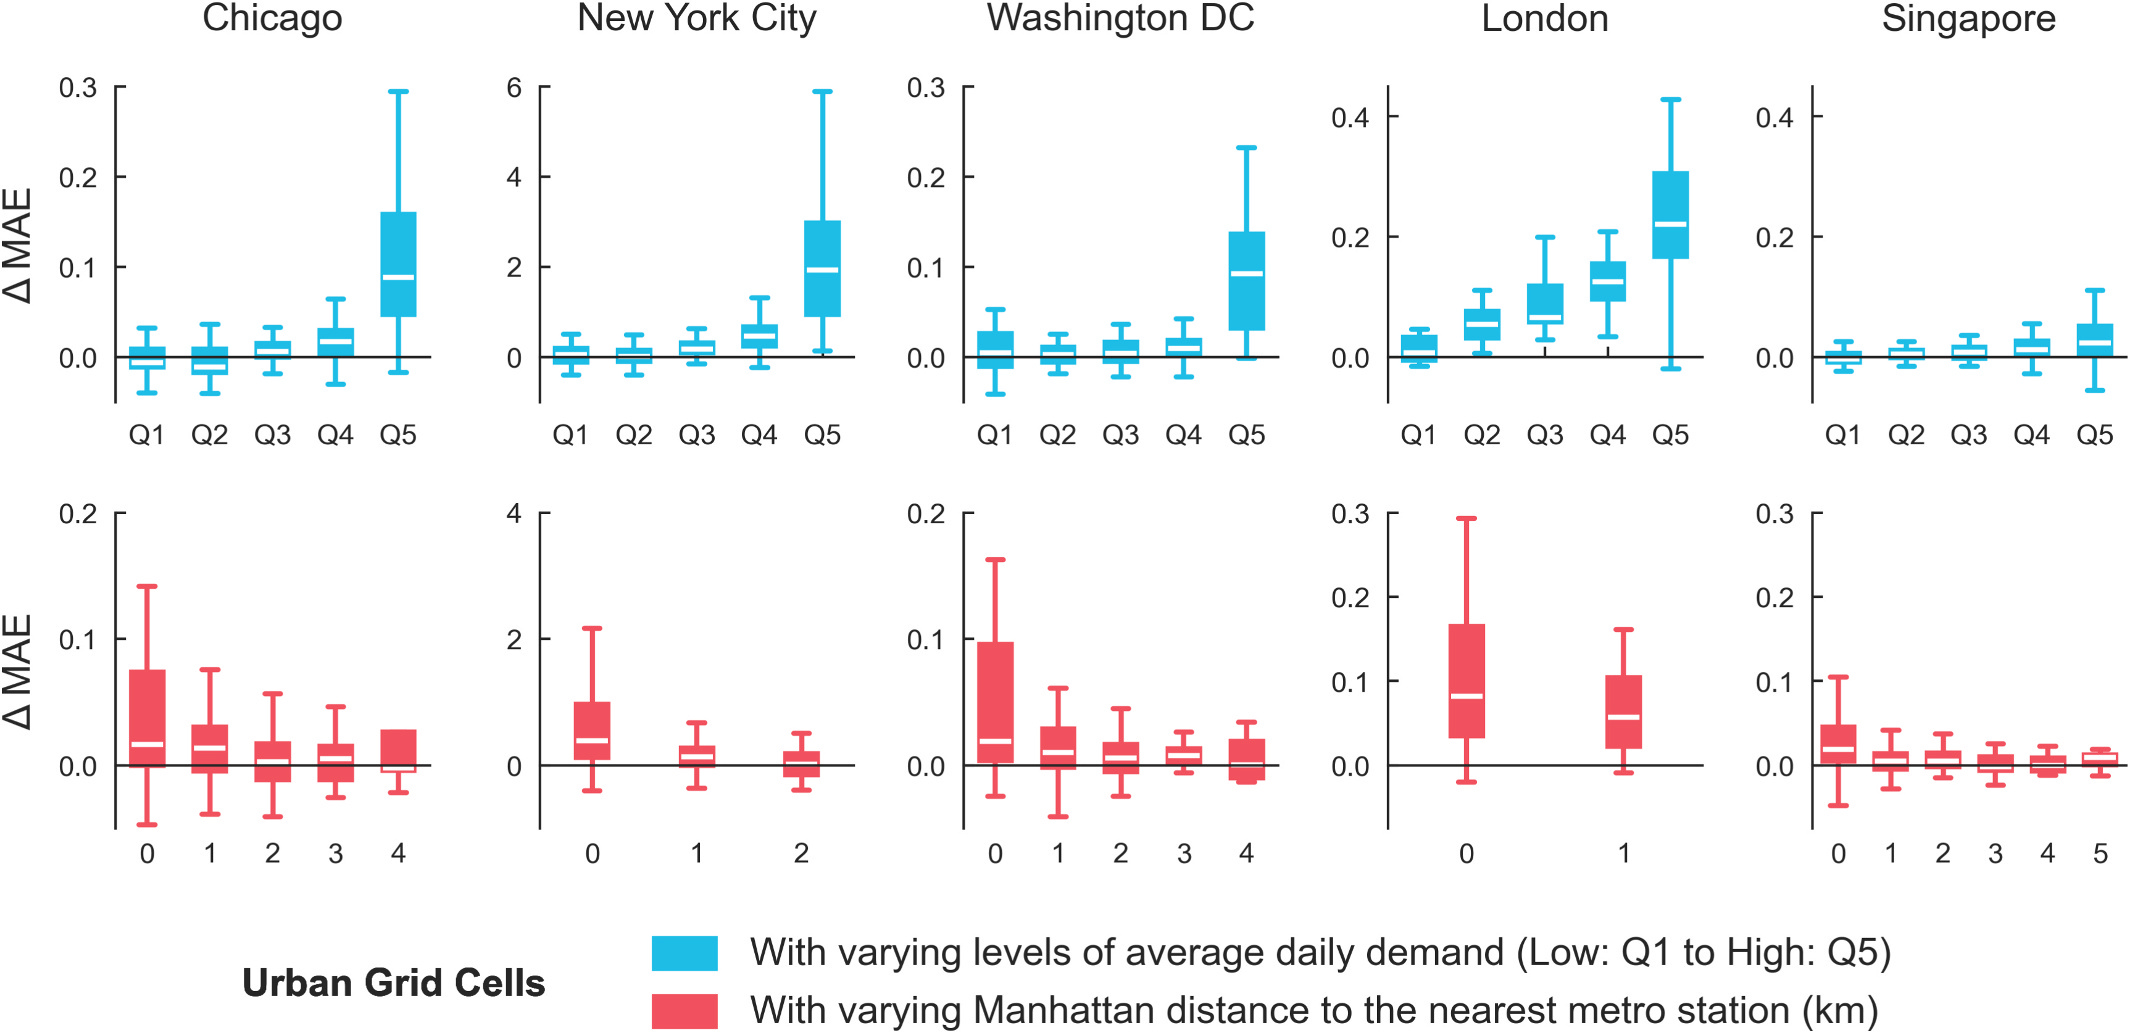
To further characterize these spatial variations, we analyze the relationships between prediction improvements and two factors, namely, demand intensity and proximity to metro station. Fig. 6 shows a consistent correlation between demand levels and prediction improvements across the cities. The patterns indicate that the benefits brought by GeoTopo-Net are concentrated in areas with greater metro connectivity and higher demand intensity. High-demand areas generally exhibit the largest accuracy gains, except in Singapore, where improvements remain modest even in usage-intensive areas. This may reflect the distinctive interaction patterns of dockless system and relatively less developed cycling routes in Singapore during the study period (2017). The analysis also indicates that areas near metro stations experience significantly greater prediction improvements compared to more distant locations. This result underscores the benefit of integrating metro network topology into demand forecast, particularly where bike sharing serves as a first- or last-mile transportation option.
6. Discussion and conclusion
This study introduces a deep learning framework (GeoTopo-Net) to improve short-term demand forecast for urban bike sharing systems. Different from existing solutions, GeoTopo-Net jointly models the dependency of travel demand in continuous and network spaces. The model’s design is inspired by the unique characteristics of bike sharing demand, which varies notably across urban spaces but exhibits interrelated temporal patterns along transportation networks. Our evaluation of GeoTopo-Net in five different cities suggests that this new solution could enhance bike sharing demand prediction, particularly in high-demand areas and those near the metro networks.
While existing solutions typically model spatial dependency of bike sharing demand in Euclidean space or among bike sharing stations, our findings suggest that incorporating topological dependencies within urban transportation networks (e.g., metro and cycling networks) could enhance demand prediction and model robustness. Given their functional connections with bike sharing systems, these networks provide valuable information on the interactions of bike sharing demand among critical areas in a city. The improvements enabled by GeoTopo-Net underscore the importance of considering complex spatial interactions and network structures in bike sharing demand forecast. Different from using data-driven approaches to construct topological networks (Li et al., 2023), GeoTopo-Net utilizes physical transportation networks as prior knowledge, which simplifies the modeling process and provides more interpretable representations of spatial dependencies.
The comparative analysis reveals the differential benefits of urban transportation network integration and performance variations across model structures. When incorporating a single transportation network, the model with the metro network demonstrates greater performance improvements compared to that of the cycling network. When the two networks are combined to form a more holistic representation of network structure, the model is able to yield more robust predictions. By further testing the two model variants, we find that the sequential structure of GeoTopo-Net yields better results when multiple urban transportation networks are involved. This structure more effectively integrates the topological dependency of demand within transportation networks based on the dependency features extracted from continuous space. These findings offer practical implications for urban bike sharing prediction. In London, for example, incorporating metro networks proves particularly valuable for bike sharing demand forecast, as users frequently integrate bike sharing into their multimodal travel patterns (Morton et al., 2021). For Singapore, the combination of sequential structure with the metro network yields the best overall performance, as the parallel structure may not effectively capture the role of shared bikes as a first-mile facilitator (Xu et al., 2019; Zhang et al., 2021b).
The spatial analysis of model performance shows that areas near metro stations and high-demand locations benefit most from metro network integration. This finding highlights how incorporating urban transportation networks enhances the prediction performance for bike sharing demand. The concentrated performance improvements along the metro network reveal the significant interconnections between bike sharing systems and metro networks. It provides practical implications for promoting cycling as a green mobility solution for cities. Previous studies suggested that introducing new metro service could boost bike sharing demand in surrounding areas (Yang et al., 2019) and metro station ridership tended to correlate with bike sharing usage (Fu et al., 2023). Building on these findings, our results suggest that strategic placement of bike sharing stations in relation to transportation networks could facilitate more accurate forecasts and improve system management. The dockless system in Singapore derives only modest benefits from GeoTopo-Net. This limited advantage may be attributable to the more diffuse spatial patterns of demand typically observed in dockless systems as compared to station-based systems (Ji et al., 2020). In station-based systems, trips generally start and end at fixed docks, which are often strategically located near transit hubs to facilitate convenient transfer. Such a configuration tends to create a clearer spatial relationship between the bike sharing system and the metro network, which the GeoTopo-Net is designed to detect and leverage. By contrast, the dockless system permits trips to originate and terminate at any location (Li et al., 2024b), which leads to a more dispersed relationship between bike trip locations and transit stations. The increased spatial “fuzziness” may make it more challenging for our model to identify strong topological signals, since the connection between a bike trip and a specific metro station tends to be less direct and predictable.
Our research demonstrates the effectiveness of GeoTopo-Net in enhancing bike sharing demand prediction by integrating urban transportation networks. Future work could expand this study in several directions. First, while GeoTopo-Net effectively incorporates existing urban transportation networks and achieves favorable results, these networks are dynamic and subject to continuous evolution. Future research could focus on developing new solutions that can accommodate these dynamic network changes, including schedule variations and structural modifications. Second, to isolate and clearly evaluate the impact of integrating topological dependencies from transportation network, our study excludes exogenous variables such as weather conditions and special events. The temporal demand volatility induced by weather conditions may introduce prediction errors (Guzel et al., 2025). Since GeoTopo-Net is designed to extract spatiotemporal regularities linked to transportation network and ridership patterns, integrating external weather data could improve responsiveness to such disruptions. Third, given the potential applicability of GeoTopo-Net, it is meaningful to evaluate the model for predicting other types of travel demand. For instance, short-term forecast of ride-hailing (Jin et al., 2020) or electric vehicle charging demand (Yi et al., 2022) may benefit from the model, as these demands also exhibit spatial dependencies among nearby areas and along particular urban networks (e.g., public transit; energy network). In sum, this research contributes to the advancement of bike sharing demand prediction with a new deep learning framework. The framework can be extended to support other spatiotemporal prediction tasks that involve complex interdependencies in urban spaces.
Declaration of Generative AI and AI-assisted technologies in the writing process
During the preparation of this work, the authors used ChatGPT‑4o in order to check the grammar and improve its clarity and readability. After using this tool, the authors reviewed and edited the content as needed and take full responsibility for the content of the publication.
CRediT authorship contribution statement
Shen Liang: Writing – original draft, Writing – review & editing, Methodology, Software, Visualization, Data curation, Formal analysis. Yang Xu: Writing – review & editing, Conceptualization, Methodology, Resources, Visualization, Supervision, Funding acquisition. Guangyue Li: Writing – review & editing, Software, Formal analysis. Xiaohu Zhang: Writing – review & editing. Qiuping Li: Writing – review & editing.
Declaration of competing interest
The authors declare that they have no known competing financial interests or personal relationships that could have appeared to influence the work reported in this paper.
Acknowledgement
The authors would like to thank the editor and anonymous reviewers for their valuable comments that improved this article. This research is supported by the National Natural Science Foundation of China (Grant No. 42171454).
Appendix A. Supplementary data
Supplementary data to this article can be found online at doi:10.1016/j.tbs.2025.101152.
References
- Ai, T., 2022. Some thoughts on deep learning empowering cartography. J. Geogr. Cartogr. 5, 25–40. doi:10.24294/jgc.v5i2.1670.
- Batty, M., 2013. Hierarchies and Networks, in: The New Science of Cities. The MIT Press, pp. 151–178.
- Beecham, R., Wood, J., Bowerman, A., 2014. Studying commuting behaviours using collaborative visual analytics. Comput. Environ. Urban Syst., Progress Movement Anal. Experiences Real Data 47, 5–15. doi:10.1016/j.compenvurbsys.2013.10.007.
- Bhatti, U.A., Tang, H., Wu, G., Marjan, S., Hussain, A., 2023. Deep learning with graph convolutional networks: an overview and latest applications in computational intelligence. Int. J. Intell. Syst. 2023, 8342104. doi:10.1155/2023/8342104.
- Cervero, R., Kockelman, K., 1997. Travel demand and the 3Ds: density, diversity, and design. Transp. Res. Part Transp. Environ. 2, 199–219. doi:10.1016/S1361-9209(97)00009-6.
- Chai, D., Wang, L., Yang, Q., 2018. Bike flow prediction with multi-graph convolutional networks, in: Proceedings of the 26th ACM SIGSPATIAL International Conference on Advances in Geographic Information Systems. Presented at the SIGSPATIAL ’18: 26th ACM SIGSPATIAL International Conference on Advances in Geographic Information Systems, ACM, Seattle Washington, pp. 397–400. doi:10.1145/3274895.3274896.
- Chen, P.-C., Hsieh, H.-Y., Su, K.-W., Sigalingging, X.K., Chen, Y.-R., Leu, J.-S., 2020. Predicting station level demand in a bike-sharing system using recurrent neural networks. IET Intel. Transport Syst. 14, 554–561. doi:10.1049/iet-its.2019.0007.
- Chen, Y., Wang, W., Hua, X., Yu, W., Xiao, J., 2024. Discrete wavelet transform application for bike sharing system check-in/out demand prediction. Transp. Lett. 16, 554–565. doi:10.1080/19427867.2023.2219045.
- Cho, J.-H., Ham, S.W., Kim, D.-K., 2021. Enhancing the accuracy of peak hourly demand in bike-sharing systems using a graph convolutional network with public transit usage data. Transp. Res. Rec. 2675, 554–565. doi:10.1177/03611981211012003.
- Christaller, W., 1966. Central Places in Southern Germany. Prentice-Hall.
- Defferrard, M., Bresson, X., Vandergheynst, P., 2016. Convolutional Neural Networks on Graphs with Fast Localized Spectral Filtering, in: Advances in Neural Information Processing Systems. Presented at the NIPS 2016, Barcelona, Spain. doi:10.48550/arXiv.1606.09375.
- Di, Y., Xu, M., Zhu, Z., Yang, H., 2025. A copula-based approach for multi-modal demand dependence modeling: Temporal correlation between demand of subway and bike-sharing. Travel Behav. Soc. 38, 100908. doi:10.1016/j.tbs.2024.100908.
- Faghih-Imani, A., Eluru, N., 2016. Incorporating the impact of spatio-temporal interactions on bicycle sharing system demand: a case study of New York CitiBike system. J. Transp. Geogr. 54, 218–227. doi:10.1016/j.jtrangeo.2016.06.008.
- Feng, J., Liu, H., 2024. An adaptive spatial-temporal method capturing for short-term bike-sharing prediction. IEEE Trans. Intell. Transp. Syst. 1–14. doi:10.1109/TITS.2024.3406682.
- Feng, J., Liu, H., Zhou, J., Zhou, Y., 2024. A Spatial-Temporal Aggregated Graph Neural Network for Docked Bike-sharing Demand Forecasting. ACM Trans Knowl Discov Data 18, 232:1-232:27. doi:10.1145/3690388.
- Feng, S., Chen, H., Du, C., Li, J., Jing, N., 2018. A Hierarchical Demand Prediction Method with Station Clustering for Bike Sharing System, in: 2018 IEEE Third International Conference on Data Science in Cyberspace (DSC). Presented at the 2018 IEEE Third International Conference on Data Science in Cyberspace (DSC), pp. 829–836. doi:10.1109/DSC.2018.00133.
- Fey, M., Lenssen, J.E., 2019. Fast graph representation learning with PyTorch geometric. ICLR Workshop on Representation Learning on Graphs and Manifolds.
- Fosgerau, M., Łukawska, M., Paulsen, M., Rasmussen, T.K., 2023. Bikeability and the induced demand for cycling. Proc. Natl. Acad. Sci. 120, e2220515120. doi:10.1073/pnas.2220515120.
- Fu, C., Huang, Z., Scheuer, B., Lin, J., Zhang, Y., 2023. Integration of dockless bike-sharing and metro: prediction and explanation at origin-destination level. Sustain. Cities Soc. 99, 104906. doi:10.1016/j.scs.2023.104906.
- Gammelli, D., Wang, Y., Prak, D., Rodrigues, F., Minner, S., Pereira, F.C., 2022. Predictive and prescriptive performance of bike-sharing demand forecasts for inventory management. Transp. Res. Part C Emerg. Technol. 138, 103571. doi:10.1016/j.trc.2022.103571.
- Gao, F., He, S.Y., Han, C., Liang, J., 2024. The impact of shared mobility on metro ridership: the non-linear effects of bike-sharing and ride-hailing services. Travel Behav. Soc. 37, 100842. doi:10.1016/j.tbs.2024.100842.
- Gao, K., Yang, Y., Li, A., Li, J., Yu, B., 2021. Quantifying economic benefits from free-floating bike-sharing systems: a trip-level inference approach and city-scale analysis. Transp. Res. Part Policy Pract. 144, 89–103. doi:10.1016/j.tra.2020.12.009.
- Goodchild, M.F., 2004. The validity and usefulness of laws in geographic information science and geography. Ann. Assoc. Am. Geogr. 94, 300–303. doi:10.1111/j.1467-8306.2004.09402008.x.
- Guzel, D., Altintasi, O., Korkut, S.O., 2025. Assessment of weather-driven travel behavior on a small-scale docked bike-sharing system usage. Travel Behav. Soc. 38, 100927. doi:10.1016/j.tbs.2024.100927.
- Hamilton, W., Ying, Z., Leskovec, J., 2017. Inductive Representation Learning on Large Graphs, in: Advances in Neural Information Processing Systems. Presented at the NIPS 2017, Curran Associates, Inc.
- Harvey, D., 1992. The Condition of Postmodernity: An Enquiry Into the Origins of Cultural Change. Wiley-Blackwell.
- Hong, Y., Zhang, Y., Schindler, K., Raubal, M., 2023. Context-aware multi-head self-attentional neural network model for next location prediction. Transp. Res. Part C Emerg. Technol. 156, 104315. doi:10.1016/j.trc.2023.104315.
- Hua, M., Pereira, F.C., Jiang, Y., Chen, X., Chen, J., 2024. Transfer learning for cross-modal demand prediction of bike-share and public transit. J. Intell. Transp. Syst. 1–14. doi:10.1080/15472450.2024.2371913.
- Hulot, P., Aloise, D., Jena, S.D., 2018. Towards Station-Level Demand Prediction for Effective Rebalancing in Bike-Sharing Systems, in: Proceedings of the 24th ACM SIGKDD International Conference on Knowledge Discovery & Data Mining, KDD ’18. Association for Computing Machinery, New York, NY, USA, pp. 378–386. doi:10.1145/3219819.3219873.
- Ji, Y., Ma, X., He, M., Jin, Y., Yuan, Y., 2020. Comparison of usage regularity and its determinants between docked and dockless bike-sharing systems: a case study in Nanjing, China. J. Clean. Prod. 255, 120110. doi:10.1016/j.jclepro.2020.120110.
- Jiang, W., 2022. Bike sharing usage prediction with deep learning: a survey. Neural Comput. & Applic. 34, 15369–15385. doi:10.1007/s00521-022-07380-5.
- Jin, G., Cui, Y., Zeng, L., Tang, H., Feng, Y., Huang, J., 2020. Urban ride-hailing demand prediction with multiple spatio-temporal information fusion network. Transp. Res. Part C Emerg. Technol. 117, 102665. doi:10.1016/j.trc.2020.102665.
- Jin, S.T., Sui, D.Z., 2024. A comparative analysis of the spatial determinants of e-bike and e-scooter sharing link flows. J. Transp. Geogr. 119, 103959. doi:10.1016/j.jtrangeo.2024.103959.
- Kaltenbrunner, A., Meza, R., Grivolla, J., Codina, J., Banchs, R., 2010. Urban cycles and mobility patterns: exploring and predicting trends in a bicycle-based public transport system. Pervasive Mob. Comput., Human. Behav. Ubiquitous Environ. Model. Hum. Mobility Patterns 6, 455–466. doi:10.1016/j.pmcj.2010.07.002.
- Kipf, T.N., Welling, M., 2017. Semi-Supervised Classification with Graph Convolutional Networks, in: International Conference on Learning Representations. Presented at the ICLR 2017, Toulon, France. doi:10.48550/arXiv.1609.02907.
- Knowles, R.D., 2006. Transport shaping space: differential collapse in time–space. J. Transp. Geogr. 14, 407–425. doi:10.1016/j.jtrangeo.2006.07.001.
- Kong, H., Jin, S.T., Sui, D.Z., 2020. Deciphering the relationship between bikesharing and public transit: modal substitution, integration, and complementation. Transp. Res. Part Transp. Environ. 85, 102392. doi:10.1016/j.trd.2020.102392.
- Li, G., Wang, J., Zhao, Z., Chen, Y., Tang, L., Li, Q., 2024a. Advancing complex urban traffic forecasting: a fully attentional spatial-temporal network enhanced by graph representation. Int. J. Appl. Earth Obs. Geoinformation 134, 104237. doi:10.1016/j.jag.2024.104237.
- Li, Q., Zhang, E., Luca, D., Fuerst, F., 2024b. The travel pattern difference in dockless micro-mobility: Shared e-bikes versus shared bikes. Transp. Res. Part Transp. Environ. 130, 104179. doi:10.1016/j.trd.2024.104179.
- Li, X., Xu, Y., Chen, Q., Wang, L., Zhang, X., Shi, W., 2022. Short-term forecast of bicycle usage in bike sharing systems: a spatial-temporal memory network. IEEE Trans. Intell. Transp. Syst. 23, 10923–10934. doi:10.1109/tits.2021.3097240.
- Li, X., Xu, Y., Zhang, X., Shi, W., Yue, Y., Li, Q., 2023. Improving short-term bike sharing demand forecast through an irregular convolutional neural network. Transp. Res. Part C Emerg. Technol. 147, 103984. doi:10.1016/j.trc.2022.103984.
- Liang, Y., Huang, G., Zhao, Z., 2024a. Cross-mode knowledge adaptation for bike sharing demand prediction using domain-adversarial graph neural networks. IEEE Trans. Intell. Transp. Syst. 25, 3642–3653. doi:10.1109/TITS.2023.3322717.
- Liang, Y., Zhao, Z., Ding, F., Tang, Y., He, Z., 2024b. Time-dependent trip generation for bike sharing planning: a multi-task memory-augmented graph neural network. Inf. Fusion 106, 102294. doi:10.1016/j.inffus.2024.102294.
- Lin, L., He, Z., Peeta, S., 2018. Predicting station-level hourly demand in a large-scale bike-sharing network: a graph convolutional neural network approach. Transp. Res. Part C Emerg. Technol. 97, 258–276. doi:10.1016/j.trc.2018.10.011.
- Liu, H., Dong, Z., Jiang, R., Deng, Jiewen, Deng, Jinliang, Chen, Q., Song, X., 2023. Spatio-Temporal Adaptive Embedding Makes Vanilla Transformer SOTA for Traffic Forecasting, in: Proceedings of the 32nd ACM International Conference on Information and Knowledge Management. Presented at the CIKM ’23: The 32nd ACM International Conference on Information and Knowledge Management, ACM, Birmingham United Kingdom, pp. 4125–4129. doi:10.1145/3583780.3615160.
- Liu, Z., Fang, C., Li, H., Wu, J., Zhou, L., Werner, M., 2024. Efficiency and equality of the multimodal travel between public transit and bike-sharing accounting for multiscale. Sustain. Cities Soc. 101, 105096. doi:10.1016/j.scs.2023.105096.
- Lv, Y., Zhi, D., Sun, H., Qi, G., 2021. Mobility pattern recognition based prediction for the subway station related bike-sharing trips. Transp. Res. Part C Emerg. Technol. 133, 103404. doi:10.1016/j.trc.2021.103404.
- Mi, Z., Coffman, D., 2019. The sharing economy promotes sustainable societies. Nat. Commun. 10, 1214. doi:10.1038/s41467-019-09260-4.
- Morton, C., Kelley, S., Monsuur, F., Hui, T., 2021. A spatial analysis of demand patterns on a bicycle sharing scheme: evidence from London. J. Transp. Geogr. 94, 103125. doi:10.1016/j.jtrangeo.2021.103125.
- Paszke, A., Gross, S., Massa, F., Lerer, A., Bradbury, J., Chanan, G., Killeen, T., Lin, Z., Gimelshein, N., Antiga, L., Desmaison, A., Kopf, A., Yang, E., DeVito, Z., Raison, M., Tejani, A., Chilamkurthy, S., Steiner, B., Fang, L., Bai, J., Chintala, S., 2019. PyTorch: An Imperative Style, High-Performance Deep Learning Library, in: Advances in Neural Information Processing Systems. Curran Associates, Inc.
- Peng, Z., Huang, X., 2022. Spatial-temporal transformer network with self-supervised learning for traffic flow prediction. Proceedings of the 1st International Workshop on Spatio-Temporal Reasoning and Learning. Presented at the STRL 22’.
- Qian, H., Wang, J., Chen, Y., Zheng, S., Wei, Z., 2025. CGA-STNet: a dockless shared bicycle demand prediction model considering multiple spatial features and time periodicity. Expert Syst. Appl. 265, 126100. doi:10.1016/j.eswa.2024.126100.
- Saltykova, K., Ma, X., Yao, L., Kong, H., 2022. Environmental impact assessment of bike-sharing considering the modal shift from public transit. Transp. Res. Part Transp. Environ. 105, 103238. doi:10.1016/j.trd.2022.103238.
- Shi, X., Chen, Z., Wang, H., Yeung, D.-Y., Wong, W., Woo, W., 2015. Convolutional LSTM Network: a machine learning approach for precipitation nowcasting, in: Proceedings of the 28th International Conference on Neural Information Processing Systems - Volume 1, NIPS’15. MIT Press, Cambridge, MA, USA, pp. 802–810.
- Tobler, W.R., 1970. A Computer Movie Simulating Urban Growth in the Detroit Region. Econ. Geogr.
- Veličković, P., Cucurull, G., Casanova, A., Romero, A., Liò, P., Bengio, Y., 2018. Graph Attention Networks, in: International Conference on Learning Representations. Presented at the ICLR 2018.
- Wang, J., Jiang, J., Jiang, W., Li, C., Zhao, W.X., 2021. In: LibCity: an Open Library for Traffic Prediction. Association for Computing Machinery, New York, NY, USA, pp. 145–148. doi:10.1145/3474717.3483923.
- Xiang, Z., Zeng, F., Liu, L., Wu, J., Mumtaz, S., Leung, V.C.M., 2025. Bike-sharing demand prediction based on dynamic time warping and spatio-temporal graph attention network. IEEE Trans. Intell. Transp. Syst. 1–15. doi:10.1109/TITS.2025.3570009.
- Xu, C., Ji, J., Liu, P., 2018. The station-free sharing bike demand forecasting with a deep learning approach and large-scale datasets. Transp. Res. Part C Emerg. Technol. 95, 47–60. doi:10.1016/j.trc.2018.07.013.
- Xu, M., Di, Y., Yang, H., Chen, X., Zhu, Z., 2023a. Multi-task supply-demand prediction and reliability analysis for docked bike-sharing systems via transformer-encoder-based neural processes. Transp. Res. Part C Emerg. Technol. 147, 104015. doi:10.1016/j.trc.2023.104015.
- Xu, Y., Chen, D., Zhang, X., Tu, W., Chen, Y., Shen, Y., Ratti, C., 2019. Unravel the landscape and pulses of cycling activities from a dockless bike-sharing system. Comput. Environ. Urban Syst. 75, 184–203. doi:10.1016/j.compenvurbsys.2019.02.002.
- Xu, Y., Ke, Q., Zhang, X., Zhao, X., 2024. ICN: Interactive convolutional network for forecasting travel demand of shared micromobility. GeoInformatica. doi:10.1007/s10707-024-00525-9.
- Xu, Y., Zhao, X., Zhang, X., Paliwal, M., 2023b. Real-time forecasting of dockless scooter-sharing demand: a spatio-temporal multi-graph transformer approach. IEEE Trans. Intell. Transp. Syst. 24, 8507–8518. doi:10.1109/TITS.2023.3239309.
- Yan, X., Gan, X., Tang, J., Zhang, D., Wang, R., 2024. ProSTformer: progressive space-time self-attention model for short-term traffic flow forecasting. IEEE Trans. Intell. Transp. Syst. 1–15. doi:10.1109/TITS.2024.3367754.
- Yang, Y., Heppenstall, A., Turner, A., Comber, A., 2020. Using graph structural information about flows to enhance short-term demand prediction in bike-sharing systems. Comput. Environ. Urban Syst. 83, 101521. doi:10.1016/j.compenvurbsys.2020.101521.
- Yang, Y., Heppenstall, A., Turner, A., Comber, A., 2019. A spatiotemporal and graph-based analysis of dockless bike sharing patterns to understand urban flows over the last mile. Comput. Environ. Urban Syst. 77, 101361. doi:10.1016/j.compenvurbsys.2019.101361.
- Yao, X., Feng, J., 2024. An end to end two-stream framework for station-level bike-sharing flow prediction. Expert Syst. Appl. 247, 123273. doi:10.1016/j.eswa.2024.123273.
- Yi, Z., Liu, X.C., Wei, R., 2022. Electric vehicle demand estimation and charging station allocation using urban informatics. Transp. Res. Part Transp. Environ. 106, 103264. doi:10.1016/j.trd.2022.103264.
- Zhang, C., Zhang, L., Liu, Y., Yang, X., 2018. Short-term prediction of bike-sharing usage considering public transport: a LSTM approach. In: 2018 21st International Conference on Intelligent Transportation Systems (ITSC). Presented at the 2018 21st International Conference on Intelligent Transportation Systems (ITSC), pp. 1564–1571. doi:10.1109/itsc.2018.8569726.
- Zhang, J., Chen, F., Cui, Z., Guo, Y., Zhu, Y., 2021a. Deep learning architecture for short-term passenger flow forecasting in urban rail transit. IEEE Trans. Intell. Transp. Syst. 22, 7004–7014. doi:10.1109/TITS.2020.3000761.
- Zhang, J., Zheng, Y., Qi, D., 2017. Deep spatio-temporal residual networks for citywide crowd flows prediction. Proc. AAAI Conf. Artif. Intell. 31. doi:10.1609/aaai.v31i1.10735.
- Zhang, X., Shen, Y., Zhao, J., 2021b. The mobility pattern of dockless bike sharing: a four-month study in Singapore. Transp. Res. Part Transp. Environ. 98, 102961. doi:10.1016/j.trd.2021.102961.
- Zhao, T., Huang, Z., Tu, W., He, B., Cao, R., Cao, J., Li, M., 2022. Coupling graph deep learning and spatial-temporal influence of built environment for short-term bus travel demand prediction. Comput. Environ. Urban Syst. 94, 101776. doi:10.1016/j.compenvurbsys.2022.101776.
- Zhu, B., Hu, S., Kaparias, I., Zhou, W., Ochieng, W., Lee, D.-H., 2024. Revealing the driving factors and mobility patterns of bike-sharing commuting demands for integrated public transport systems. Sustain. Cities Soc. 104, 105323. doi:10.1016/j.scs.2024.105323.
- Zhuang, C., Li, S., Liu, X., 2025. Unveiling disparities in bicycling mobility patterns across socioeconomic statuses: a framework for identifying user profiles in dockless bike-sharing systems. Ann. Am. Assoc. Geogr. 1–23. doi:10.1080/24694452.2025.2463508.